
Mobility is an important part of social participation and enables social interaction and participation in different spaces such as employment, health services, and educational and cultural facilities (Runge 2005: 5; Daubitz 2011: 183; Ward/Walsh 2023: 1). Various disadvantaged population groups who are restricted in their access to public or private mobility services for different reasons suffer the consequences of this exclusion (Runge 2005: 5; Lucas/Mattioli/Verlinghieri et al. 2016: 355; Collins/Der Wartanian/Reed et al. 2023: 2). Indeed, such a lack of access may not only cause social exclusion, it can also result from it (Daubitz 2011: 183). Lower economic status is associated with a reduced number of journeys, shorter journey times and a lower proportion of car ownership (Lucas/Mattioli/Verlinghieri et al. 2016: 354; Nobis/Kuhnimhof 2019: 27–29, 33; Ward/Walsh 2023: 2, 4), as well as limited participation in social activities and employment options (Ward/Walsh 2023: 4–5). People with limited or no access to a private car or who deliberately refrain from using private cars are often dependent on public transport. However, the mere absence of a private car does not necessarily indicate a general disadvantage. Especially in central and dense urban locations, not owning a car can also be a conscious decision justified by a shortage of parking spaces, attractive public transport connections, cost advantages or other benefits (Church/Frost/Sullivan 2000: 197; Stadt Köln 2017: 175).
Economic aspects play a key role in this context, as they not only determine direct access to mobility options in the form of ticket acquisition (Daubitz/Aberle/Schwedes et al. 2023: 12–13), but also indirectly influence mobility options in form of socio-spatial distribution patterns such as segregation (Beckmann/Bracher/Hesse 2007: 14). In addition to financial barriers to access, the transportation system itself can have other access-restricting effects, such as poor accessibility, service quality or connection quality (Runge 2005: 10). Population groups with specific socio-spatial affiliations thus have different options influencing their choice of transport and exhibit different mobility behaviour (Daubitz 2021: 79–80; Ward/Walsh 2023: 2).
Even though questions of mobility-related social disadvantage and the socio-spatial differentiation of participation opportunities have become an increasing focus in the scientific literature, they have so far received little attention in local political consideration and transport planning (Daubitz 2011: 181) or in publications on mobility-related social reporting (Hausigke/Kruse 2021: 270). For the city of Cologne, serving as the research area of this study, it should be noted that mobility-related and, in particular, public-transport-related aspects of social disadvantage are only briefly mentioned and addressed in Cologne’s current local transport plan, in the current guidelines for the creation of the mobility concept “mobil 2025” and in the current city strategy paper “Cologne Perspectives 2030+” (Stadt Köln 2014; Stadt Köln 2017; Stadt Köln 2023).
| – |
How is the proportion of Cologne’s population receiving social benefits distributed across the city and how does public transport provision relate to these sub-areas?
|
| – |
In which sub-areas do low economic status and below-average public transport provision, in combination with additional indicators, suggest a potential risk of mobility-related social exclusion for the resident population?
|
In the following sections, we discuss the literature on transport disadvantage and mobility-related social exclusion (Section 2). We then present the case study (Section 3) and methods used (Section 4). Finally, we present (Section 5) and discuss the findings (Section 6) and limitations (Section 7) and conclude with implications for subsequent research (Section 8).
Since the early 2000s, the research field of mobility1 and social exclusion has become increasingly relevant in the Anglo-American region (Lucas 2012: 105). According to the widely used approach by Lucas, Mattioli, Verlinghieri et al. (2016: 355), four sub-concepts are subsumed under the overarching concept of transport poverty: mobility poverty, accessibility difficulties, lack of transport funding and exposure to external transport impacts.
The term “mobility poverty” refers to a systematic lack of mobility options due to insufficient transport services and infrastructure (Lucas/Mattioli/Verlinghieri et al. 2016: 356; Schwerdtfeger 2019: 45), such as inadequate service coverage, low frequency and poor accessibility of public transport stops (Schwedes/Daubitz/Rammert et al. 2018: 76). The second sub-concept, accessibility poverty, addresses whether people can reach everyday destinations with a reasonable time expenditure, cost and physical or psychological effort (Lucas/Mattioli/Verlinghieri et al. 2016: 356; Schwerdtfeger 2019: 45). The third, transport affordability, concerns the availability of financial resources for mobility, such as the use of private vehicles or public transport (Lucas/Mattioli/Verlinghieri et al. 2016: 355). The fourth, exposure to transport externalities, refers to burdens caused by negative transport impacts. Here, the concept of environmental justice becomes relevant, addressing the social distribution of environmental burdens (e.g. pollution, noise, road severance, accidents) and resources (e.g. green and recreational spaces), and associated health outcomes (Böhme/Franke/Preuß 2019: 28).
To better integrate individual and subjective characteristics, Henkel and Sommer (2024: 152) expand the concept by combining objective indicators (e.g. transport supply) with subjective “mobility options”. These include not only material and monetary resources but also individual abilities and social roles and attitudes. Similarly, Daubitz and Aberle (2020: 7) emphasise the relevance of subjective variables, such as cycling skills or the use of digital mobility platforms, for potential and realised mobility.
The three sub-concepts mobility poverty, accessibility poverty and transport affordability can both result from and cause a lack of mobility options. This connection highlights how a systematic shortage of options can limit individuals’ ability to realise geographical mobility, potentially reducing social participation and leading to social exclusion (Schwedes/Daubitz/Rammert et al. 2018: 79).
“The term social exclusion refers to the lower levels in the evolving hierarchies of access to, participation in, and autonomy with regard to, economic life […], political life […], social life […], cultural life […] and health […]” (Schwanen/Lucas/Akyelken et al. 2015: 125). Social exclusion does not describe a state that excludes or includes individuals or groups, but is rather a fluid, dynamic and relative concept (Schwanen/Lucas/Akyelken et al. 2015: 125; Fischer/Rozynek/Henkel et al. 2024: 26). The economic, political and social/cultural dimensions, which are used to define social exclusion in many definitions, are often expanded in the context of mobility research to include other dimensions, such as spatial, temporal, organisational, health and fear-based dimensions (Church/Frost/Sullivan 2000; Cass/Shove/Urry 2005: 550-551; Rozynek/Schwerdtfeger/Lanzendorf 2020: 3). Mobility-related exclusion describes “the process by which people are prevented from participating in the economic, political and social life of the community because of reduced accessibility to opportunities, services and social networks, due to in whole or in part insufficient mobility in a society and environment built around the assumption of high mobility” (Kenyon/Lyons/Rafferty 2002: 210).
However, it is important to note that transport poverty, or the absence of adequate mobility options, does not necessarily lead to social exclusion, as social exclusion can also increase the risk of transport poverty and a lack of mobility options (Runge 2005: 21–22; Lucas 2012: 107). Daubitz (2011: 183) posits that “the absence of physical access to employment, health services, educational and cultural facilities is both a consequence of and a cause for social exclusion” (authors’ translation). This ambivalent process has the capacity to reinforce and reproduce itself (Kronauer 2009: 376), yet it is also capable of being overcome (Church/Frost/Sullivan 2000: 197; FGSV 2015: 9). The explanations show that it is impossible to determine the direction of impact between mobility-related social exclusion and access restrictions. Consequently, this study assumes an undirected relationship.
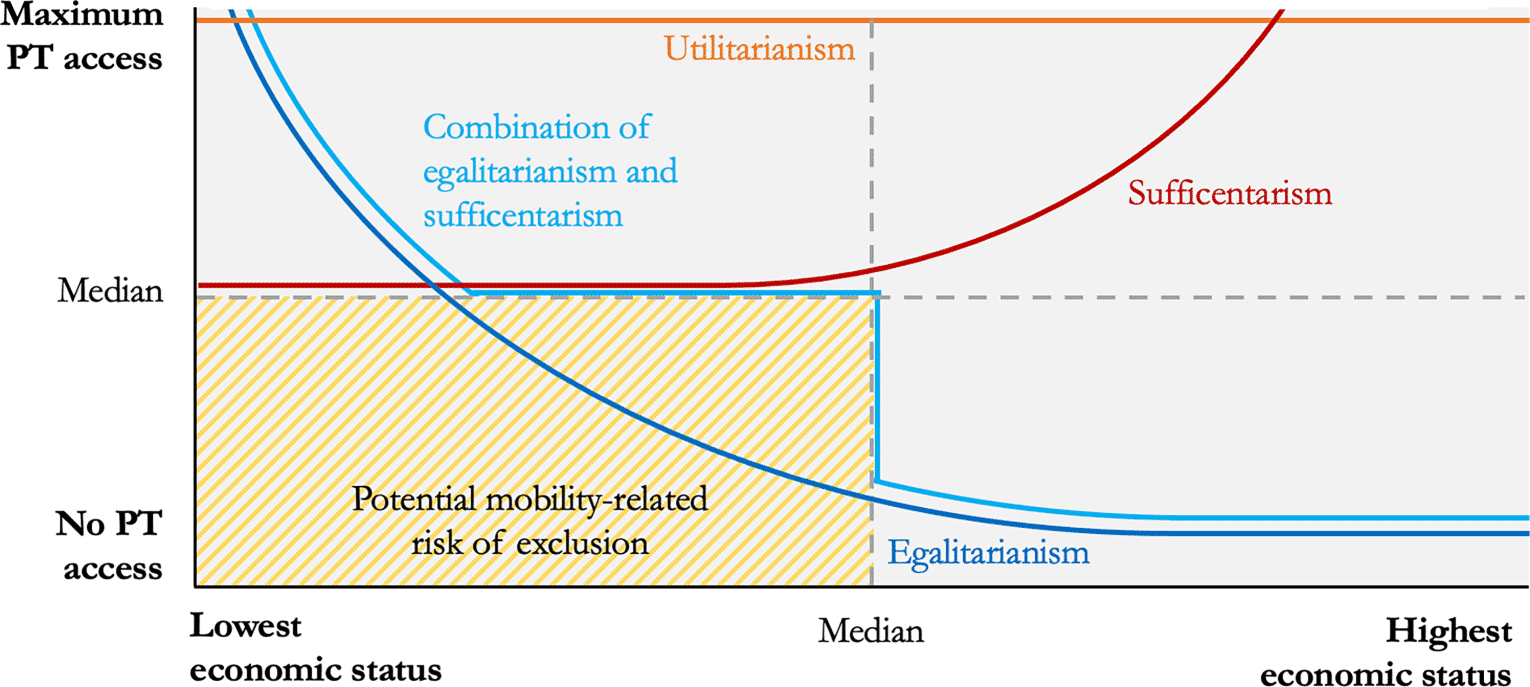
A utilitarian understanding of justly distributed public transport accessibility is characterised by maximum accessibility independent of income, thus providing the greatest possible benefit to all income classes. The sufficientarist concept focuses on the provision of a defined minimum level of public transport accessibility. In contrast, the egalitarian approach assumes greater accessibility for low-income groups in order to ensure equal opportunities for disadvantaged groups. Adli, Chowdhury and Shiftan (2019: 90) note that despite good coverage of groups with very low incomes, there may be an undersupply of groups with incomes just below the defined threshold. This is where another theory comes in, which can be understood as an extension of the egalitarian approach and which counteracts the above-mentioned criticism of the possible undersupply of some income groups with an essential element of the sufficientarist approach. The authors view this hybrid approach as extremely useful for local transport planning because it does not fall short of a minimum level of accessibility according to the sufficientarist approach and at the same time makes justifiable a certain inequality in favour of the low-income population groups, those with the most need. While theoretical considerations about the equitable distribution of mobility provision in relation to economic status provide no information on the ideal line along which an optimal distribution should be measured, an area can be identified that is characterised by a potential risk of mobility-related social exclusion (yellow shaded area, Figure 1).
In urban research, socio-spatial inequalities are often explained as an interplay between complex economic, social, spatial or socio-technical causes (van Ham/Tammaru/Ubarevičienė et al. 2021), resulting from the unequal distribution of resources and opportunities, varying influences of historical and political factors, socio-economic structural change and globalisation, or from segregation and gentrification (van Gent/Hochstenbach 2020: 307–309). Affected urban districts are often characterised by a concentration of population groups with low incomes, high unemployment and below-average education levels as a result of segregation processes (Beckmann/Bracher/Hesse 2007: 12; FGSV 2015: 18; Le Goix 2022). Structural, functional and socio-technical aspects also play an important role (Nelson/Warnier/Verma 2024). The connection between socially disadvantaged neighbourhoods and the potential risk of social exclusion (Stanley/Hensher/Stanley 2022) is based, to some extent, on the structural condition of urban neighbourhoods (Liao/Gil/Yeh et al. 2025). Additional functional quality deficits are caused by high traffic loads, deficits in educational facilities and jobs, or the lack of green and recreational areas. This often leads to multiple burdens on the residential areas, followed by an exodus of wealthier households due to social, structural and functional deficiencies, which can lead to stigmatisation of the urban quarter and its residents and a thinning out of private and public services (Beckmann/Bracher/Hesse 2007: 14; see also Nicoletti/Sirenko/Verma 2023).
In socially disadvantaged groups, participation in addressing mobility-related issues is often low (Daubitz 2021: 91). Even for rail-based public transport projects, where standardised evaluation plays a central political role, cost-benefit comparisons often neglect non-monetizable factors. Thus, many “soft” socio-spatial aspects are insufficiently considered (BMVI 2016). This supports the notion that public transport distribution follows functional and economic rather than social criteria.
In terms of sustainable mobility, Hausigke and Kruse (2021: 271–272) argue that “equal access opportunities to places of general interest and participation in public life for all […] should be given a legal entitlement through legal provisions”, while defining mobility “as a merit good in planning” (authors’ translation) allows state intervention in market-based mobility systems to better address diverse needs (Hille/Gather 2022: 43).
With around 1,096,000 inhabitants in 2023, Cologne is the largest city in North Rhine-Westphalia and within the regional transport association Verkehrsverbund Rhein-Sieg (VRS) (Stadt Köln 2024: 9). The urban area spans 40,500 hectares, stretching 27.6 km east-west and 28.1 km north-south, and comprises 86 districts grouped into nine larger administrative units (Stadt Köln 2024: 9).
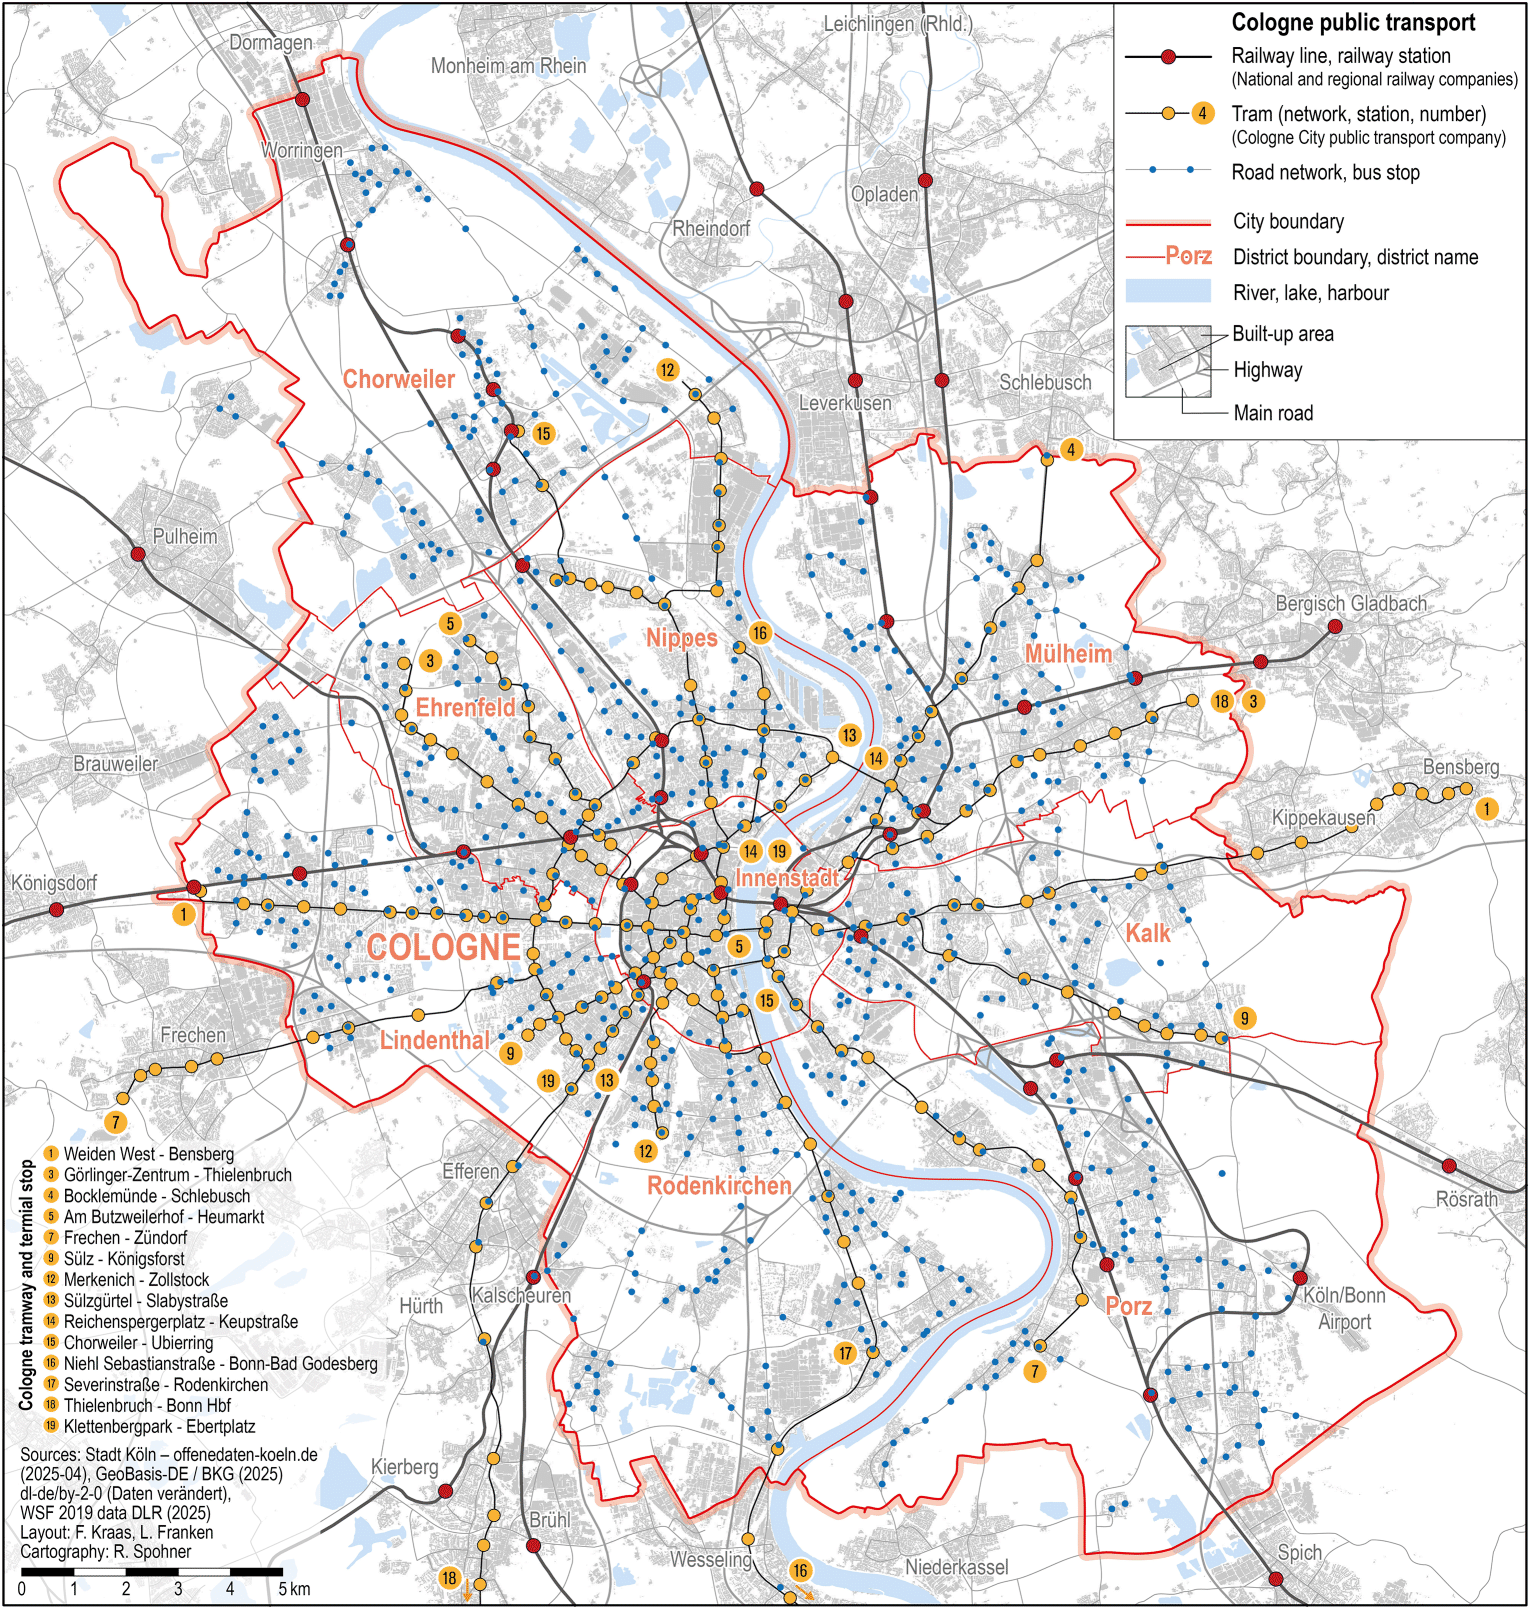
A comparison of 21 German cities showed that public transport ticket prices in Cologne in 2020 were 15 % above the national average, with some categories up to 31 % higher and social tickets slightly below the € 40.01 monthly Hartz IV3 standard for transport, but still close to the average of other cities (Bukow/Meinefeld/Schmidt 2020: 20).
Cologne was chosen as an example for four reasons, which are anchored in the “Cologne Mobility Strategy 2025” (Stadt Köln 2014) and, above all, in the principles of the “Cologne Perspectives 2030+” (Stadt Köln 2021). Firstly, the city’s integrated approach demonstrates a strong commitment to improving local public transport (Stadt Köln 2021: 65–67). Secondly, larger urban areas are not yet covered by rail-based local transport. These gaps and disparities in the network are to be closed through targeted intensification of inner-city connections (Stadt Köln 2021: 156–157, 168–169). Thirdly, there are widely varying inequalities across Cologne’s urban districts, including those with particular social challenges (large housing estates, Großwohnsiedlungen) (Stadt Köln 2021: 67, 170). In transport-related urban development, a special focus is placed on disadvantaged neighbourhoods (social spaces, Sozialraumgebiete), which are disproportionately affected by social disadvantage and poverty compared to the city as a whole (Stadt Köln 2021: 67). Potential is seen in the linking of public transport with eco-friendly transport options (e.g. shuttle services, car sharing, bike stations) (Stadt Köln 2021: 224). Fourthly, Cologne’s transport structure, which is still predominantly focused on the city centre with a significant decline in the mix of uses and density of neighbourhoods towards the outskirts, should be improved to provide better transport links to areas of the outer city with potential for housing development (Stadt Köln 2021: 165–167). Cologne’s geographic, social and infrastructural features clearly make it a suitable study area. Its mix of urban and rural spaces, high diversity and historically shaped transport infrastructure support the research focus. However, mobility-related social disadvantage is barely addressed in key planning documents like the local transport plan, the “Cologne Mobility Strategy 2025” or the “Cologne Perspectives 2030+” strategy (Stadt Köln 2014; Stadt Köln 2017; Stadt Köln 2023). In contrast, public transport provisions for people with physical mobility limitations are more clearly considered in current local transport planning (Stadt Köln 2017: 146–151).
The following research design was chosen to investigate the relationship between economic status, public transport provision and their possible impact on a potential risk of mobility-related social exclusion (PRME). First, the spatial distribution patterns of economic status and public mobility provision in the study area were localised in order to demonstrate the socio-spatial prerequisites for a potential risk of mobility-related social exclusion. The degree of potential risk was then identified at a small-scale level using further indicators.
In order to answer the first research question, which aims to localise spatial distribution patterns of economic status and public transport provision, two methodological steps were taken. First, a descriptive analysis of the spatial distribution of public transport provision and an analysis of data on the receipt of social benefits were carried out to visualise their spatial distribution and correlation. Particularly, the focus was on areas in which below-average public transport provision corresponds to areas with a high proportion of social benefit recipients. In a second step, Spearman correlation analyses were used to identify potential statistical correlations and significances and to assess whether there is a structural undersupply of public transport to financially disadvantaged people in the study area.
The potential risk of mobility-related social exclusion was determined and assessed using an additive and weighted index specifically designed for this analysis, considering additional indicators that can be derived from the theoretical principles in Section 2. An additive index model was chosen over a multiplicative model in order to allow for compensation, “i.e. poor public transport provision can be compensated by high availability of private cars or high economic status” (Bortz/Döring 2006: 145, authors’ translation). In each grid cell, points were awarded for each indicator included. The resulting index value thus reflects the relative potential risk of the mobility-related social exclusion of a grid cell in comparison to all other grid cells considered in the study area. The higher the index value of a grid cell, the higher the potential risk of mobility-related social exclusion for this grid cell. Based on the spatial distribution of the index values, spatial clusters were formed to define potential areas for action.
4.3.1 GTFS dataset
Due to the highlighted importance of public transport for disadvantaged people, the General Transit Feed Specification (GTFS) dataset served as the basis for the analysis, as it contains complex information about public transport provision in the study area. The GTFS feed was processed in the GIS application QGIS4 using the object-relational database management system PostgreSQL with the PostGIS extension.5 As part of the dataset processing, the service frequency for each means of transport (on-demand bus routes,6 bus, light rail and regional rail) and for each service day examined (Tuesday during schooltime, Saturday and Sunday) was queried from the database and then transferred to the corresponding geo-referenced stop points. For further processing, the point-based departure information had to be transformed into area-based information to do justice to the spatial access function of a stop. The sizes of the access radii, within which residents were considered to be served by public transport and to which the departure data was transferred, range from 300 metres to 800 metres depending on the means of transport and the location within the urban area (core area, peripheral area), and are defined in the strategic plan for the development of local transport (Stadt Köln 2017: 138–139). As stops can be served by more than one means of transport, several access radii of different means of transport can be located around the same stop. To avoid multiple counting of the same departure of a single vehicle in overlapping radii of neighbouring stops, the access radii of the same means of transport were transformed into Voronoi polygons, whereas overlapping areas of access radii of different means of transport (e.g. at transfer stops between bus and light rail) were not affected by this geometrical transformation.
4.3.2 Socio-spatial data on affluence
The second part of the data basis is the socio-spatial dataset with the help of which a spatially differentiated approximation of the social status of the resident population could be achieved. Provided by the City of Cologne, socio-spatial data was available at the spatial level of statistical neighbourhoods (see explanation in Section 4.4). Therefore, the data on the proportion of people entitled to the following social benefits were used: basic income support for jobseekers (SGB II), basic income support in old age (SGB XII), assistance with living expenses (SGB XII) and benefits under the Asylum Seekers Benefits Act.7 The data was supplemented by the analogously available unemployment rates (Stadt Köln 2021; Bundesagentur für Arbeit 2021), as unemployed persons do not automatically receive SGB II benefits, and simultaneously, unemployment is not necessarily a basic requirement to receive SGB II benefits.
4.3.3 Data on supplementary mobility offers
A dataset on the private car ownership rate was available at the spatial level of “statistical neighbourhoods” (Bundesagentur für Arbeit 2021). As already emphasised in the introduction, this dataset primarily served as an approximation to determine the intentional or forced dependency of car-free households on public transport.
In order to consider overall public mobility provision, additional offers such as the “ISI” on-demand service8 introduced in 2020 by the local public transport company Kölner Verkehrs-Betriebe (KVB) and the KVB bicycle rental system (KVB bike) were included in the evaluation. This was justified by the fact that, unlike numerous other mobility and sharing offers provided by private companies, under certain conditions KVB and VRS subscription customers can use both services at no additional cost to their public transport ticket.9 Therefore, only the flex zone was considered for the KVB bike,10 and only the daytime service areas11 were used for ISI.
All datasets were available in non-uniform spatial units and had to be transferred to a uniform spatial level in preparation for the bivariate correlation analysis and index formation. While the geographic INSPIRE grid system “is not an independent data model, but [describes] specifications for the georeferencing of geodata, the use of regular grid cells as a carrier of semantic information [for the representation and analysis of statistical facts] is an established procedure”.12 The merging of public transport data, socio-spatial data and data on supplementary mobility provisions onto the 100x100-metre INSPIRE grid cells was carried out by spatial intersection in QGIS. All input data was transferred from its original geometries (access radii of public transport stops, service areas of supplementary mobility provisions and data from statistical neighbourhoods) to the approximately 13,000 INSPIRE raster cells, if the cells’ geometric centres lay within the respective source geometry. The dataset was then supplemented by population numbers per grid cell (SSP Consult 2021).
As part of the index creation process, specific indicators for capturing the potential risk of mobility-related social exclusion were then derived from the data basis. Reflecting the highlighted importance of dimensions of mobility supply and economic status as manifestations of social inequality, all indicators used in the model could be assigned to one of these dimensions. Application of this theory-based selection of indicators meant that the formation of the index could be described as model-driven (Bortz/Döring 2006: 144–145; de Lange/Nipper 2018: 300).
Subdimension | # | Indicator | Characteristic class | Points | Proportionate weight |
|---|---|---|---|---|---|
PT offer | 1* | Absolute number of PT departures (weighted by means of transport) | ≤ 0.25 quantile | 2 per surveyed service day | 34% |
> 0.25 quantile und ≤ 0.5 quantile (median) | 1 per surveyed service day | ||||
> 0.5 quantile (median) | 0 per surveyed service day | ||||
2* | Relative number of PT departures (departures per inhabitant, weighted by means of transport) | ≤ 0.25 quantile | 2 per surveyed service day | ||
> 0.25 quantile und ≤ 0.5 quantile (median) | 1 per surveyed service day | ||||
> 0.5 quantile (median) | 0 per surveyed service day | ||||
3* | PT coverage (location within the access radii) | Yes | 0 per surveyed service day | ||
No | 2 per surveyed service day | ||||
Affluence | 4 | Proportion of the population receiving social benefits (rates for basic income support for jobseekers (SGB II), basic income support in old age (SGB XII), assistance with living expenses (SGB XII) and the Asylum Seekers Benefits Act (AsylbLG)) | ≤ 0.5 quantile (median) | 0 | 49% |
> 0.5 quantile (median) and ≤ 0.75 quantile | 9 | ||||
> 0.75 quantile | 18 | ||||
5 | Proportion of the unemployed population (unemployment rate) | ≤ 0.5 quantile (median) | 0 | ||
> 0.5 quantile (median) und ≤ 0.75 quantile | 4 | ||||
> 0.75 quantile | 8 | ||||
Supplementary mobility offer | 6 | Private car density | ≤ 0.25 quantile | 4 | 17% |
> 0.25 quantile und ≤ 0.5 quantile (median) | 2 | ||||
> 0.5 quantile (median) | 0 | ||||
7▲ | Location within the ISI on-demand service area | Yes | 0 per surveyed service day | ||
No | 1 per surveyed service day | ||||
8 | Location within the public bike sharing service area (KVB bike) | Yes | 0 | ||
No | 2 | ||||
TOTAL | 53 | 100% | |||
Means of public transport | Speeda | Capacityb | Short distance farec | Operational flexibilityd | Surchargee | Weight factorf |
|---|---|---|---|---|---|---|
low (1) – high (3) | low (1) – high (3) | not applicable (0) – applicable (1) | low (0) – high (1) | not applicable (0) – applicable (1) | light rail = 1.0 | |
On-demand bus routes | 1 | 1 | 1 | 1 | 0 | ≈0.7 |
Bus | 1 | 1 | 1 | 1 | 1 | ≈0.8 |
Light rail | 2 | 2 | 1 | 0 | 1 | 1.0 |
Regional train | 3 | 3 | 0 | 0 | 1 | ≈1.2 |
The “affluence” sub-dimension consisted of two indicators that approximate the economic status of the resident population. In addition to the proportion of recipients of basic benefits for jobseekers (SGB II), the indicator for recording the proportion of social benefit recipients also included the proportion of recipients of basic benefits for old age (SGB XII), assistance for subsistence (SGB XII) and assistance in line with the Asylum Seekers Benefits Act, and was already used in the previous methodological description of the bivariate correlation analysis. By considering various transfer payments, people of working age and above were covered. In addition, the unemployment rate was used as the second indicator of the “affluence” sub-dimension and describes the proportion of registered unemployed persons, who are at a particularly high risk of exclusion due to the social significance of employment described above (Daubitz 2011: 183).
The third sub-dimension was made up of indicators for recording supplementary mobility offers that were not included in the “PT” sub-dimension, such as the public bike rental system “KVB bike” and the KVB on-demand service “ISI”. Further, the density of private cars was included in order to cover the probability of access to a private car as an alternative significant means of transportation.
As the indicators were available in different units, scales and value ranges, standardisation was achieved by categorising the data (de Lange/Nipper 2018: 302–303). For all indicators used for the additive index, a PRME-favouring characteristic contributed to the index with a higher value (see Table 1). Therefore, for the dichotomous indicators 3, 7 and 8, a location outside the access radii or the service areas (“no”) resulted in a high value, while the opposite value (“yes”, located within) had a negative effect on potential risk of mobility-related social exclusion and therefore did not increase the index value. For the polytomous indicators 1, 2, 4, 5 and 6, three classes of values were formed using quartiles which represent a special form of quantile (de Lange/Nipper 2018: 77) (see Table 1). The reason for forming classes based on quartiles for the polytomous indicators was that characteristics which particularly contributed to potential risk of mobility-related social exclusion were either above average (e.g. an above-average proportion of social benefit recipients) or below average (e.g. below-average public transport provision) in polarity. The average in this context was the median which divided the sample into two equal parts.
Due to the enormous differences in the number of public transport departures and the availability of the on-demand system on Tuesday, Saturday and Sunday, an index value was calculated for each surveyed day for indicators 1, 2, 3 and 7 instead of determining only the sum of public transport departures of all surveyed service days combined.
The weighting of the indicators and sub-dimensions in the index model was structured so that the combined indicators of the sub-dimensions “PT provision” and “supplementary mobility offers” accounted for 51 % of the maximum possible score, while the sub-dimension “affluence” accounted for 49 %. The objective of this approach was to establish an approximate equilibrium between the subdimensions 1 and 3 and subdimension 2, thereby averting misinterpretation resulting from the overrepresentation of a single sub-dimension. This weighting pursued the overarching goal of constructing a high, above-average index value, which could only be achieved through the combined effect of both mobility provision and economic status.
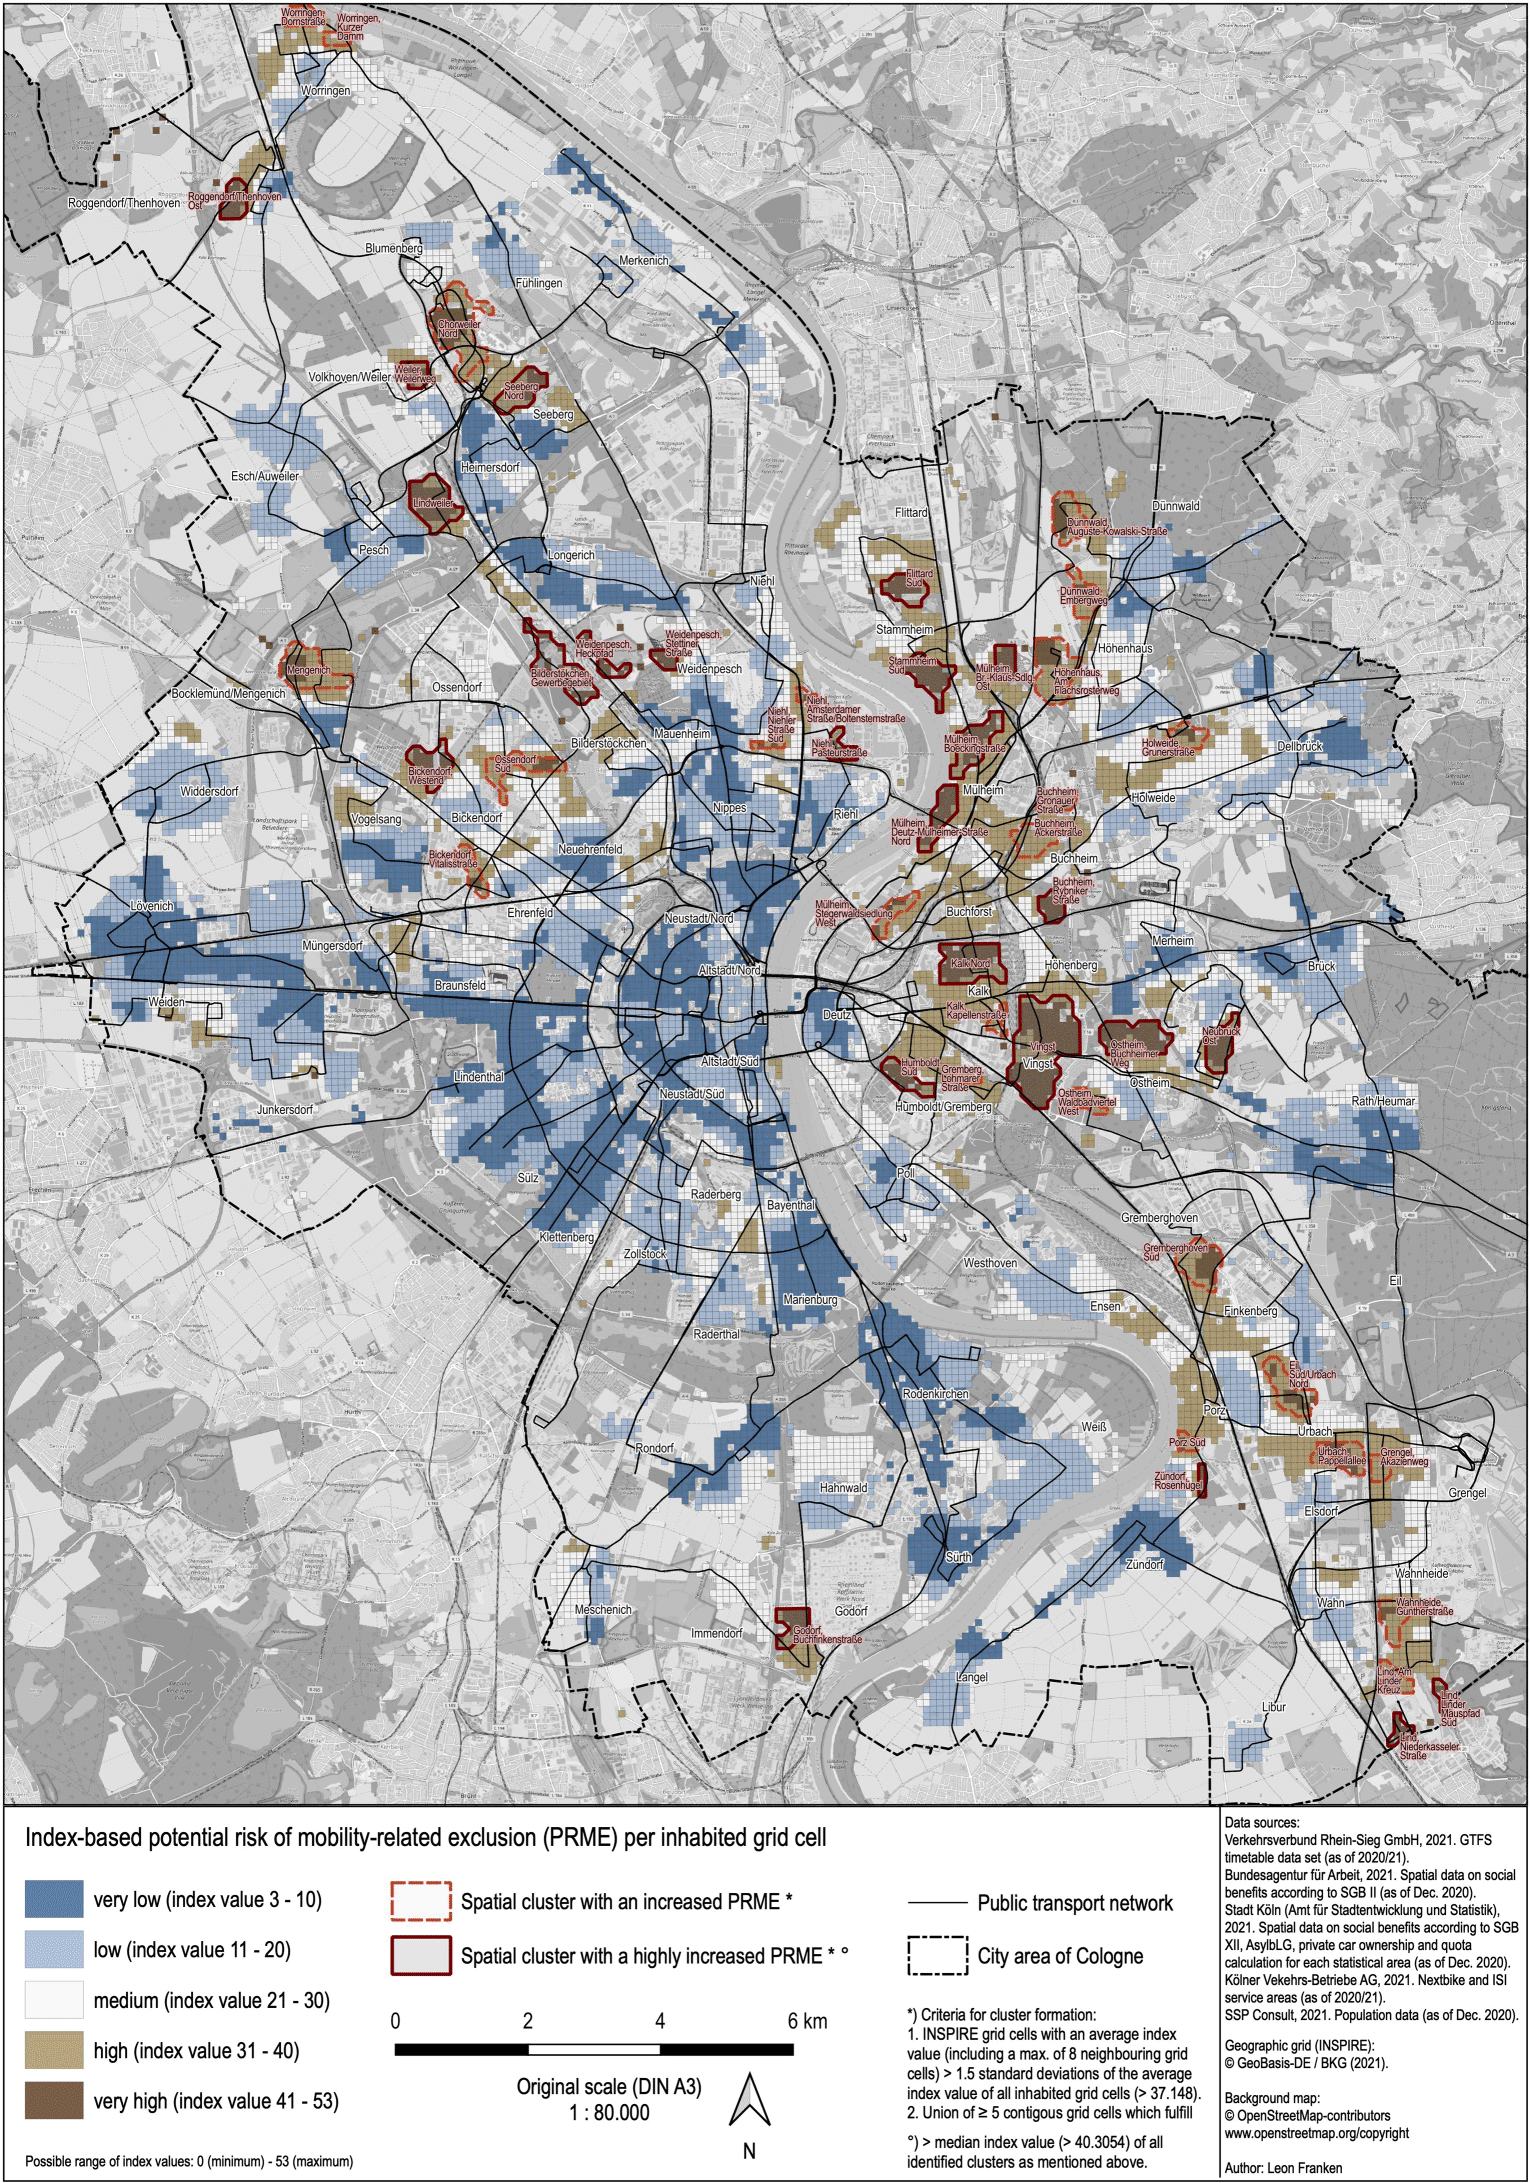
To enhance clarity, spatial clusters were formed which were characterised by an increased potential risk of mobility-related social exclusion. To reduce over-interpretation of individual grid cells with a strong outlier index value compared to adjacent cells, an average index value was calculated for each grid cell which included all index values of the maximum of eight adjacent cells. If this averaged value of a grid cell was more than 1.5 standard deviations above the arithmetic mean of all grid cells in the study area, the grid cell was assigned an increased potential risk of mobility-related social exclusion. If at least five contiguous grid cells met this criterion, they were grouped into a spatial cluster. In a further step, the spatial clusters with an average index value above the median of the average index values of all clusters were highlighted and assigned a highly increased potential risk of mobility-related social exclusion.
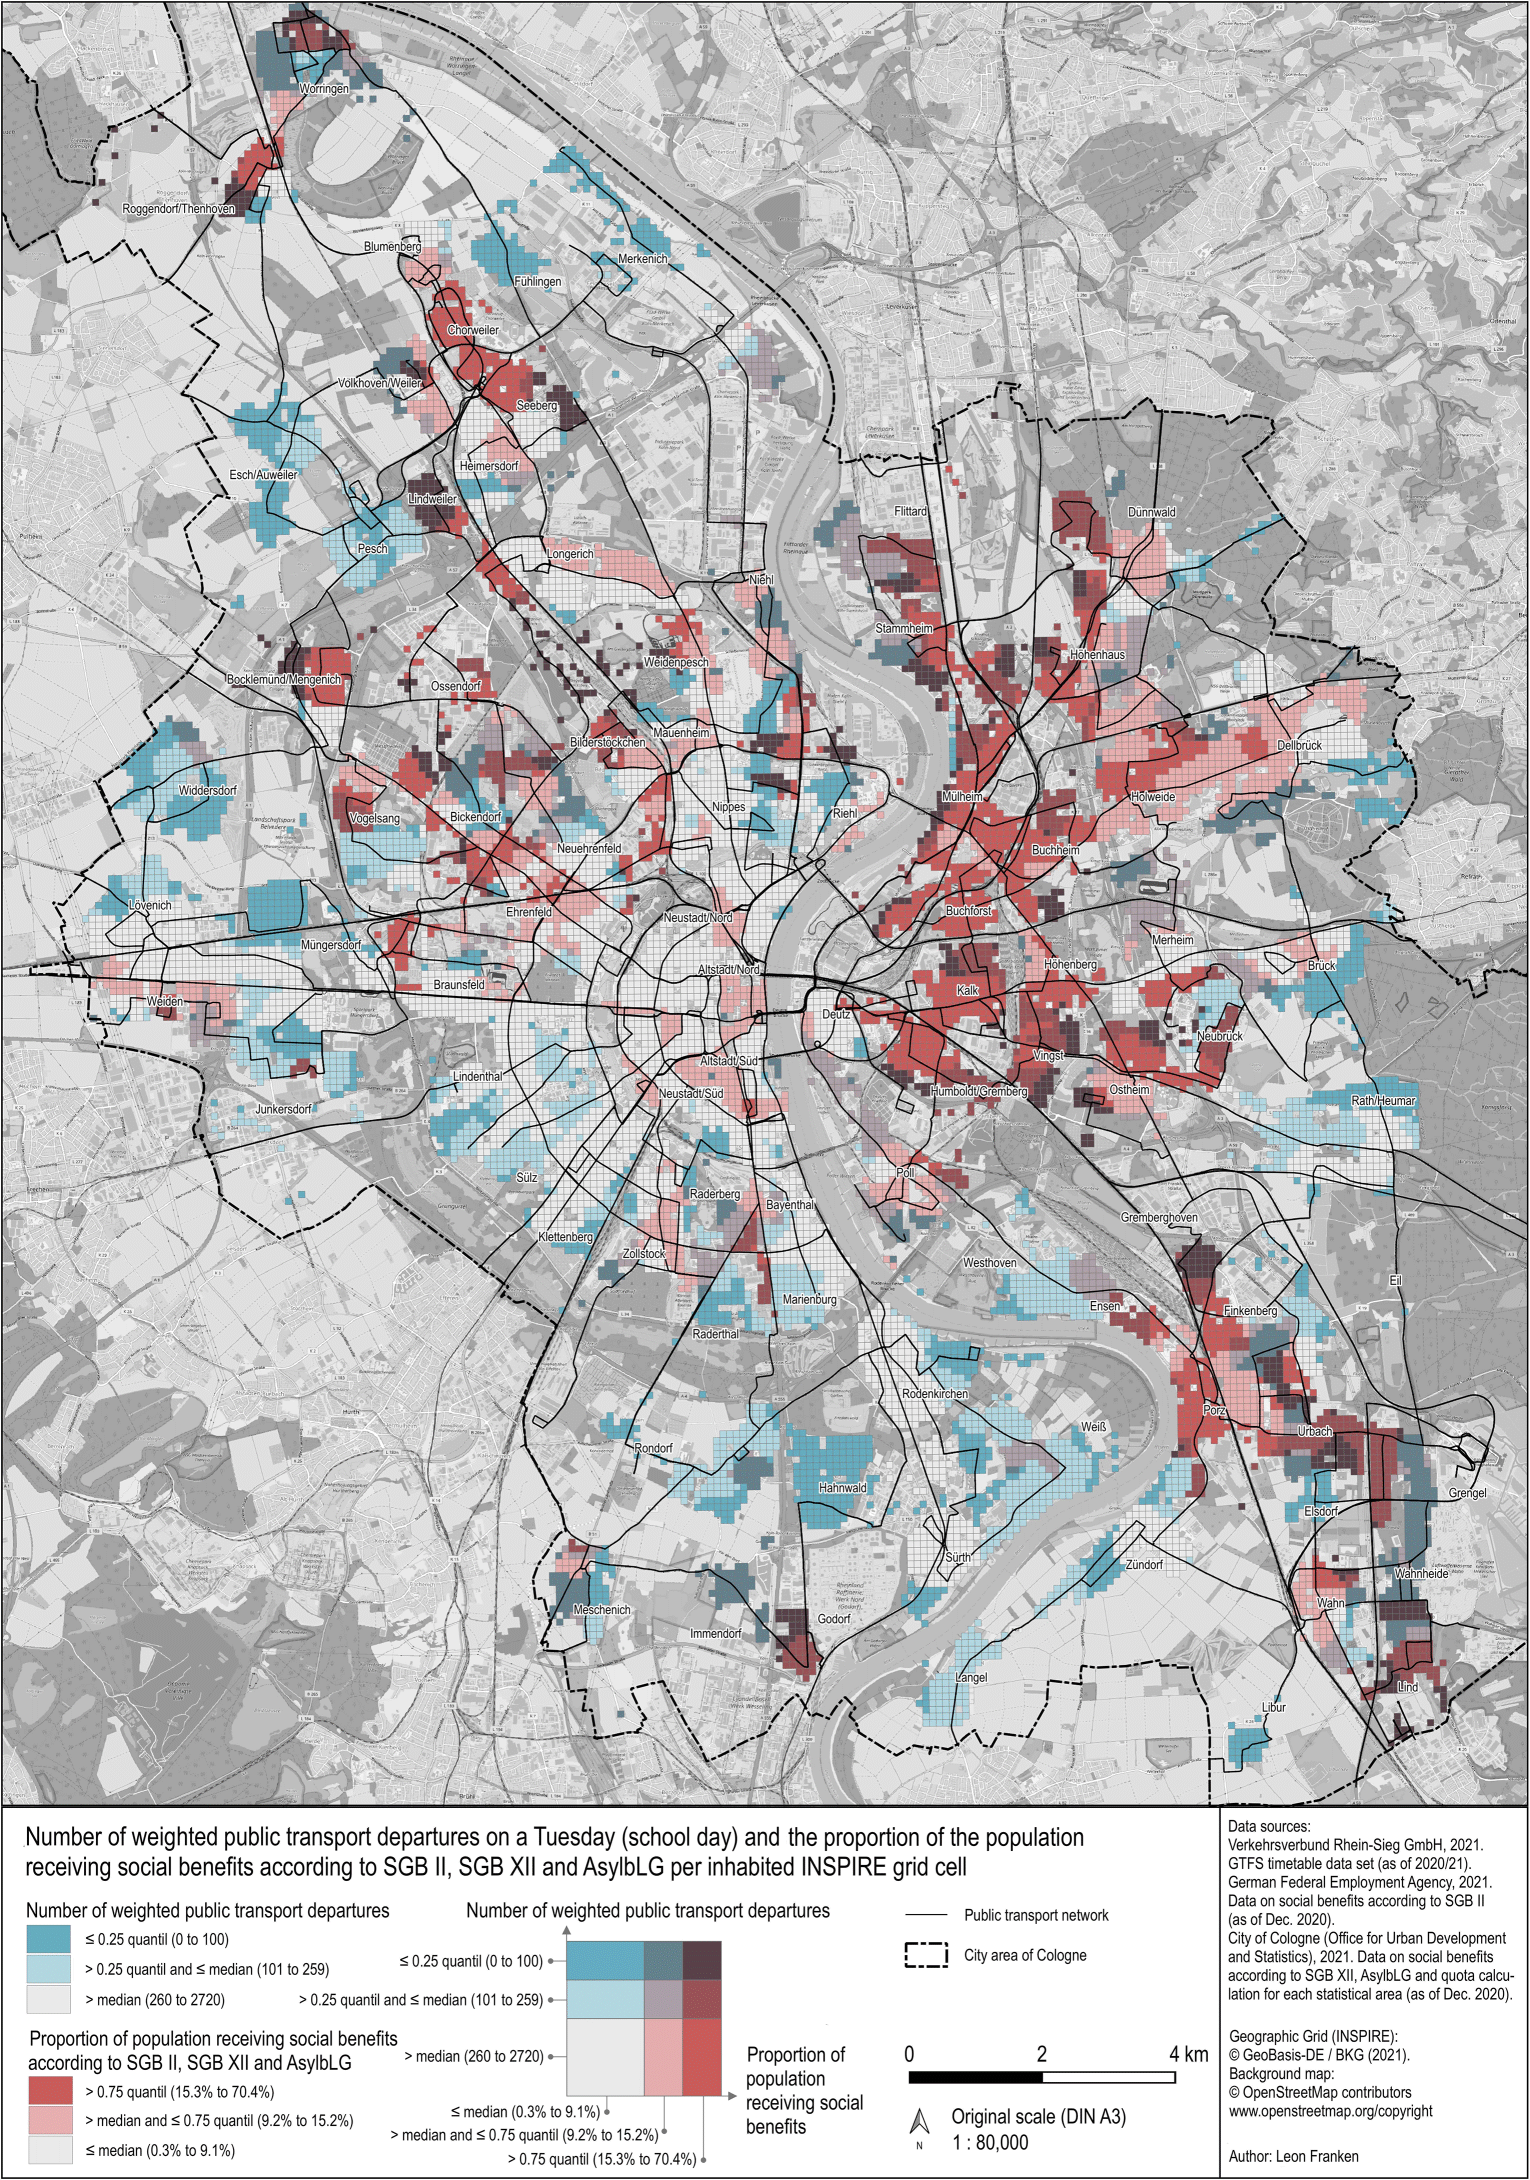
The analyses also showed the proportion of the population receiving basic income support for jobseekers (SGB II), basic income support in old age (SGB XII), subsistence assistance (SGB XII) and benefits under the Asylum Seekers Benefits Act per grid cell (see Figure 3), which served as the basis for indicator 4. Values ranged from less than 1 % to 70.4 %, with half of all grid cells between 9.1 and 15.2 %. Values under 1 % were found in Lindenthal and values well over 50 % in parts of Chorweiler, Ostheim and Meschenich. The superordinated districts of Innenstadt, Lindenthal and Rodenkirchen mostly had a low proportion of social benefits recipients, below the city-wide median of 9.1 %. In contrast, the superordinated districts of Mülheim, Kalk, Porz and parts of Ehrenfeld, Nippes and Chorweiler often had proportions above the median.
Below-average proportion of the population receiving social benefits | Above-average proportion of the population receiving social benefits | |||||
|---|---|---|---|---|---|---|
Below-average public transport provision | Grid cells: | 3,403 | (27 %) | Grid cells: | 2,963 | (23 %) |
Weighted departures (Tuesday) | Inhabitants: | 191,331 | (18 %) | Inhabitants: | 229,309 | (21 %) |
Above-average public transport provision | Grid cells: | 3,102 | (24 %) | Grid cells: | 3,270 | (26 %) |
Weighted departures (Tuesday) | Inhabitants: | 307,775 | (28 %) | Inhabitants: | 354,923 | (33 %) |
To describe possible statistical correlations between public transport provision and economic status, the weighted public transport departures (as of indicator 1) were initially checked for normal distribution to determine a suitable type of correlation analysis. As no normal distribution could be found, the Spearman correlation coefficient was used as a suitable measure of correlation. Furthermore, the unclear direction of the cause-and-effect relationship between public transport provision and the economic status of the population with social exclusion (see Section 2.3) justifies the examination of an undirected relationship.
The correlation coefficients showed the relationship between the weighted number of absolute public transport departures and the proportion of social benefit recipients (online supplementary material A). It was found that the correlation coefficients of the weighted number of public transport departures on Saturdays and Sundays correlated weakly positively with the proportion of social benefit recipients, with values between ρ = 0.100 and ρ = 0.131. Thus, with an increasing proportion of social benefit recipients, more weighted public transport departures occur. It was only for the weighted departures on Tuesdays (ρ = 0.098) that no significant correlation effect according to Cohen (1988) was found, although the value is just slightly lower than the margin of ρ = 0.1. All correlations are two-sided significant at the 0.01 level. No statistical correlation was found between the relative public transport departures per inhabitant and the proportion of social benefit recipients across all surveyed service days.
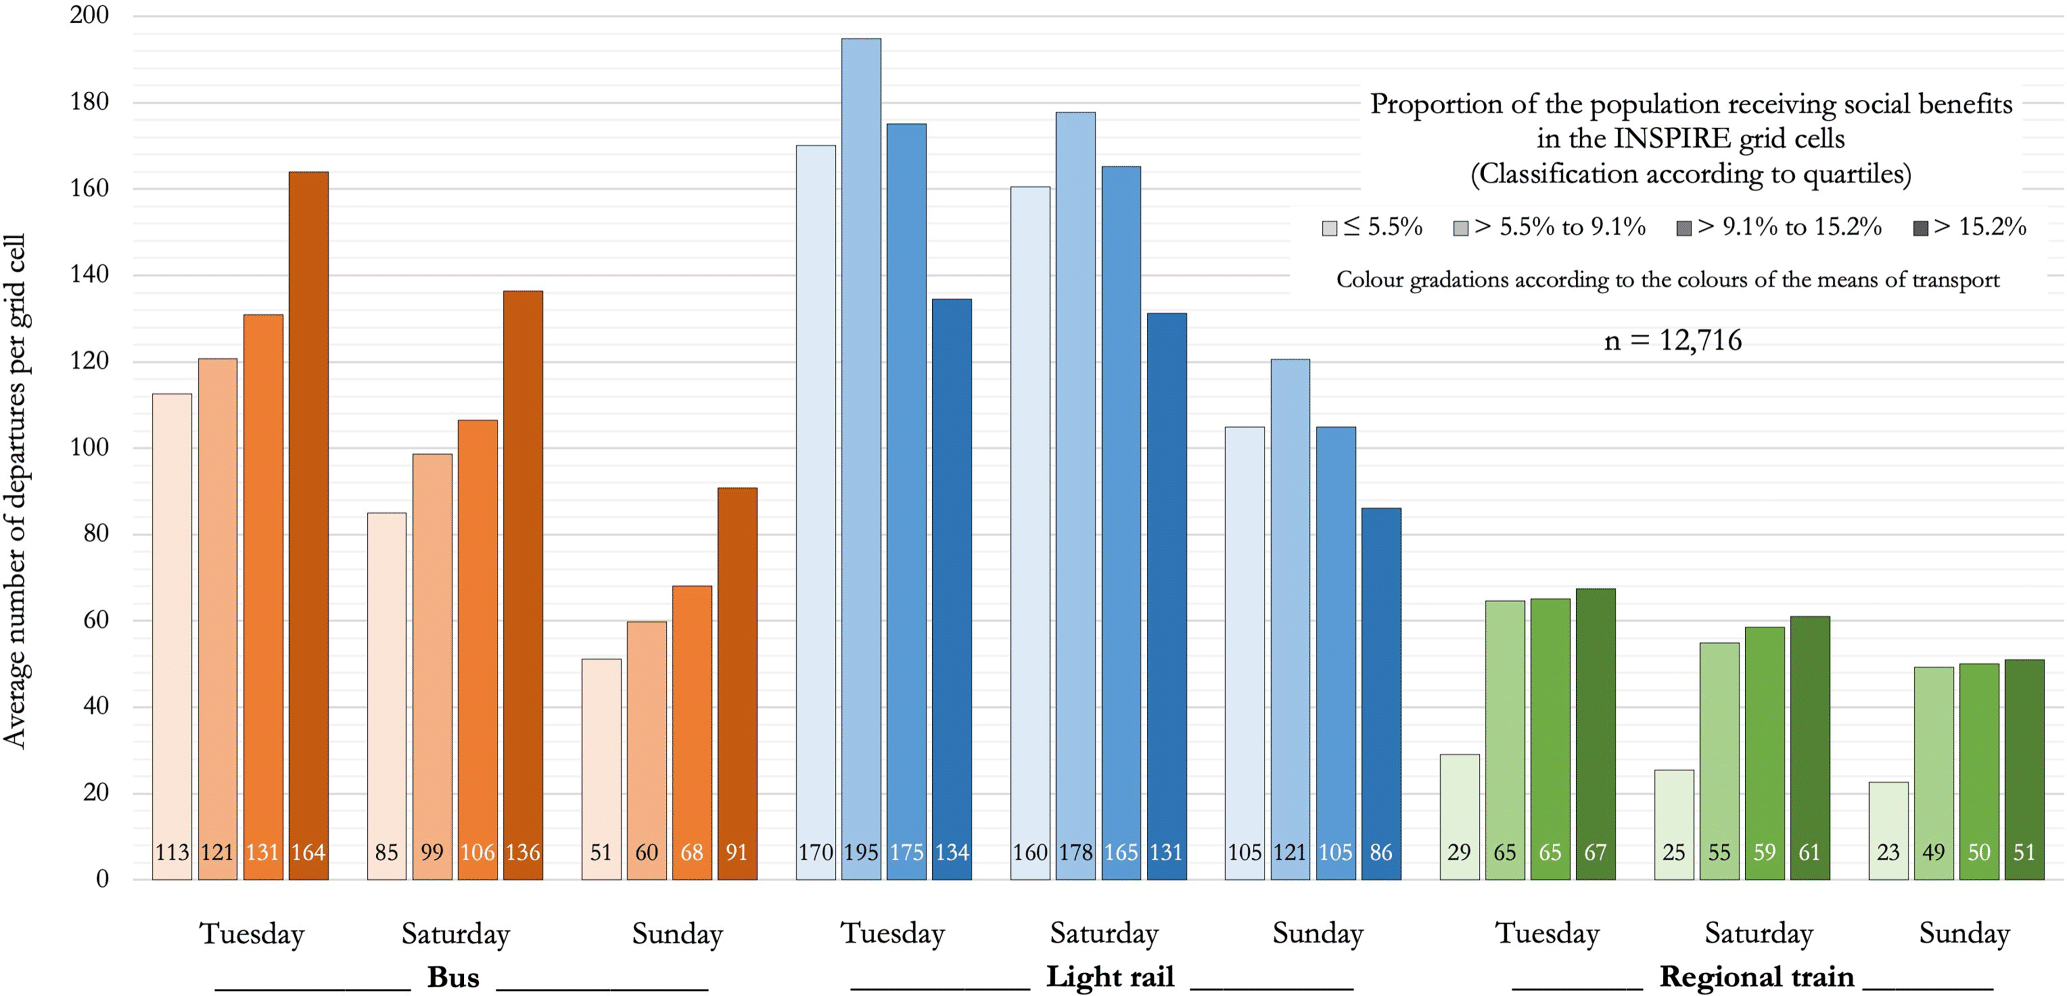
The correlation coefficients were analysed for a statistical correlation of absolute departures per means of transport in relation to the proportion of social benefit recipients (online supplementary material B). The results showed that the absolute number of bus departures and the absolute number of regional train departures on all service days examined correlated weakly positively with the proportion of social benefit recipients, with values between ρ = 0.146 and ρ = 0.212. However, the absolute number of light rail departures on all service days examined did not correlate with the proportion of social benefit recipients, with values between ρ = -0.024 and ρ = -0.048, too close to 0 to be classified as a correlation (Cohen 1988).
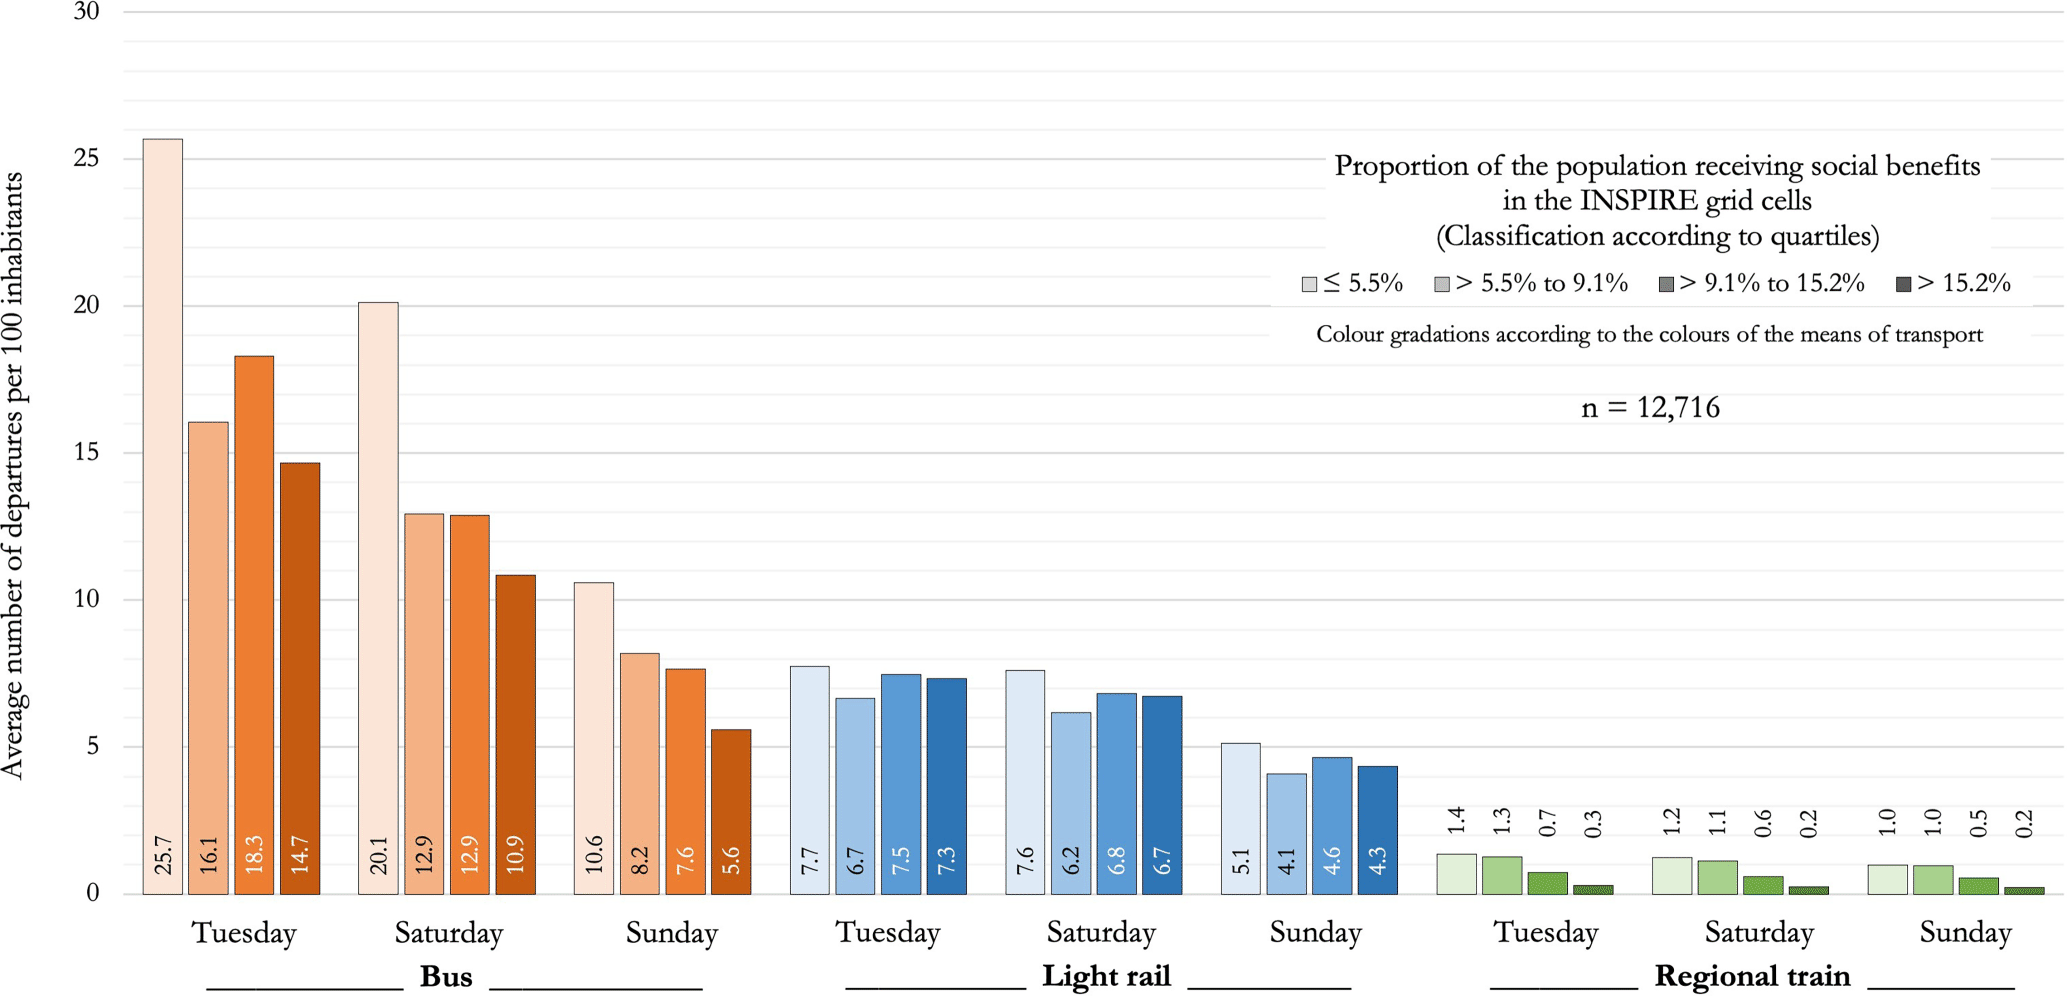
Looking at the correlation coefficients of the relative number of departures and the proportion of social benefit recipients (online supplementary material B), the relative regional train departures (values between ρ = 0.172 and ρ = 0.178) and the Sunday bus departures (ρ = 0.127) showed a weakly positive correlation effect. All correlations were two-sided significant at the 0.01 level.
index value | PRME | grid cells | % of inhabited urban area | population | % of the population | population receiving social benefits | % of the population receiving social benefits |
|---|---|---|---|---|---|---|---|
0 – 10 | very low | 3,622 | 28.4 | 313,164 | 28.9 | 13,633 | 9.4 |
11 – 20 | low | 3,529 | 27.7 | 263,870 | 24.4 | 25,382 | 17.5 |
21 – 30 | medium | 2,339 | 18.4 | 169,631 | 15.7 | 23,413 | 16.1 |
31 – 40 | high | 2,482 | 19.5 | 254,941 | 23.5 | 64,511 | 44.4 |
41 – 53 | very high | 766 | 6.0 | 81,732 | 7.5 | 18,337 | 12.6 |
12,738 | 100.0 | 1,083,338 | 100.0 | 145,276 | 100.0 |
The analysis showed that 57 % of the social benefit recipients lived in areas with a high or very high potential risk of mobility-related social exclusion, which is significantly more than that of the total population, of which only 31 % lived in such high-risk areas. At the same time, areas with low and very low potential risk of mobility-related social exclusion accommodate only 27 % of the social benefit recipients, which is significantly less than the 53 % of the overall population.
Indicator 1 | Indicator 2 | Indicator 3 | Indicator 4 | Indicator 5 | Indicator 6 | Indicator 7 | Indicator 8 | |||||||||||||
|---|---|---|---|---|---|---|---|---|---|---|---|---|---|---|---|---|---|---|---|---|
No. | Description | Average index value | Inhabitants (rank out of 49) | Area in ha | Average number of weighted public transport departures | Average number of weighted public transport departures per 100 inhabitants | Public transport coverage in percent | Average proportion of population receiving social benefits | Average proportion of unemployed population | Private cars per 100 inhabitants | Proportionate location in the service area of on-demand traffic in percent | Proportionate location in the service area of the bike rental system in percent | ||||||||
Tuesday | Saturday | Sunday | Tuesday | Saturday | Sunday | Tuesday | Saturday | Sunday | Tuesday | Saturday | Sunday | |||||||||
1 | Weidenpesch, Heckpfad | 49.00 | 317 (44.) | 10 | 0 | 0 | 0 | 0.0 | 0.0 | 0.0 | 0 | 0 | 0 | 21.4 | 12.1 | 35.7 | 0 | 0 | 0 | 100 |
2 | Lind, Linder Mauspfad Süd | 46.25 | 249 (46.) | 6 | 27 | 23 | 19 | 5.3 | 4.5 | 3.7 | 17 | 17 | 17 | 15.6 | 12.3 | 49.4 | 0 | 0 | 0 | 0 |
3 | Buchheim, Rybniker Straße | 46.21 | 768 (35.) | 14 | 0 | 0 | 0 | 0.0 | 0.0 | 0.0 | 0 | 0 | 0 | 15.5 | 8.7 | 38.5 | 0 | 0 | 0 | 0 |
4 | Stammheim Süd | 45.20 | 2517 (17.) | 26 | 87 | 82 | 57 | 6.0 | 5.6 | 3.7 | 46 | 46 | 46 | 23.7 | 13.0 | 34.1 | 0 | 0 | 0 | 0 |
5 | Lind, Niederkasseler Straße | 45.00 | 73 (49.) | 8 | 30 | 0 | 0 | 82.2 | 0.0 | 0.0 | 100 | 0 | 0 | 18.8 | 11.1 | 54.4 | 0 | 0 | 0 | 0 |
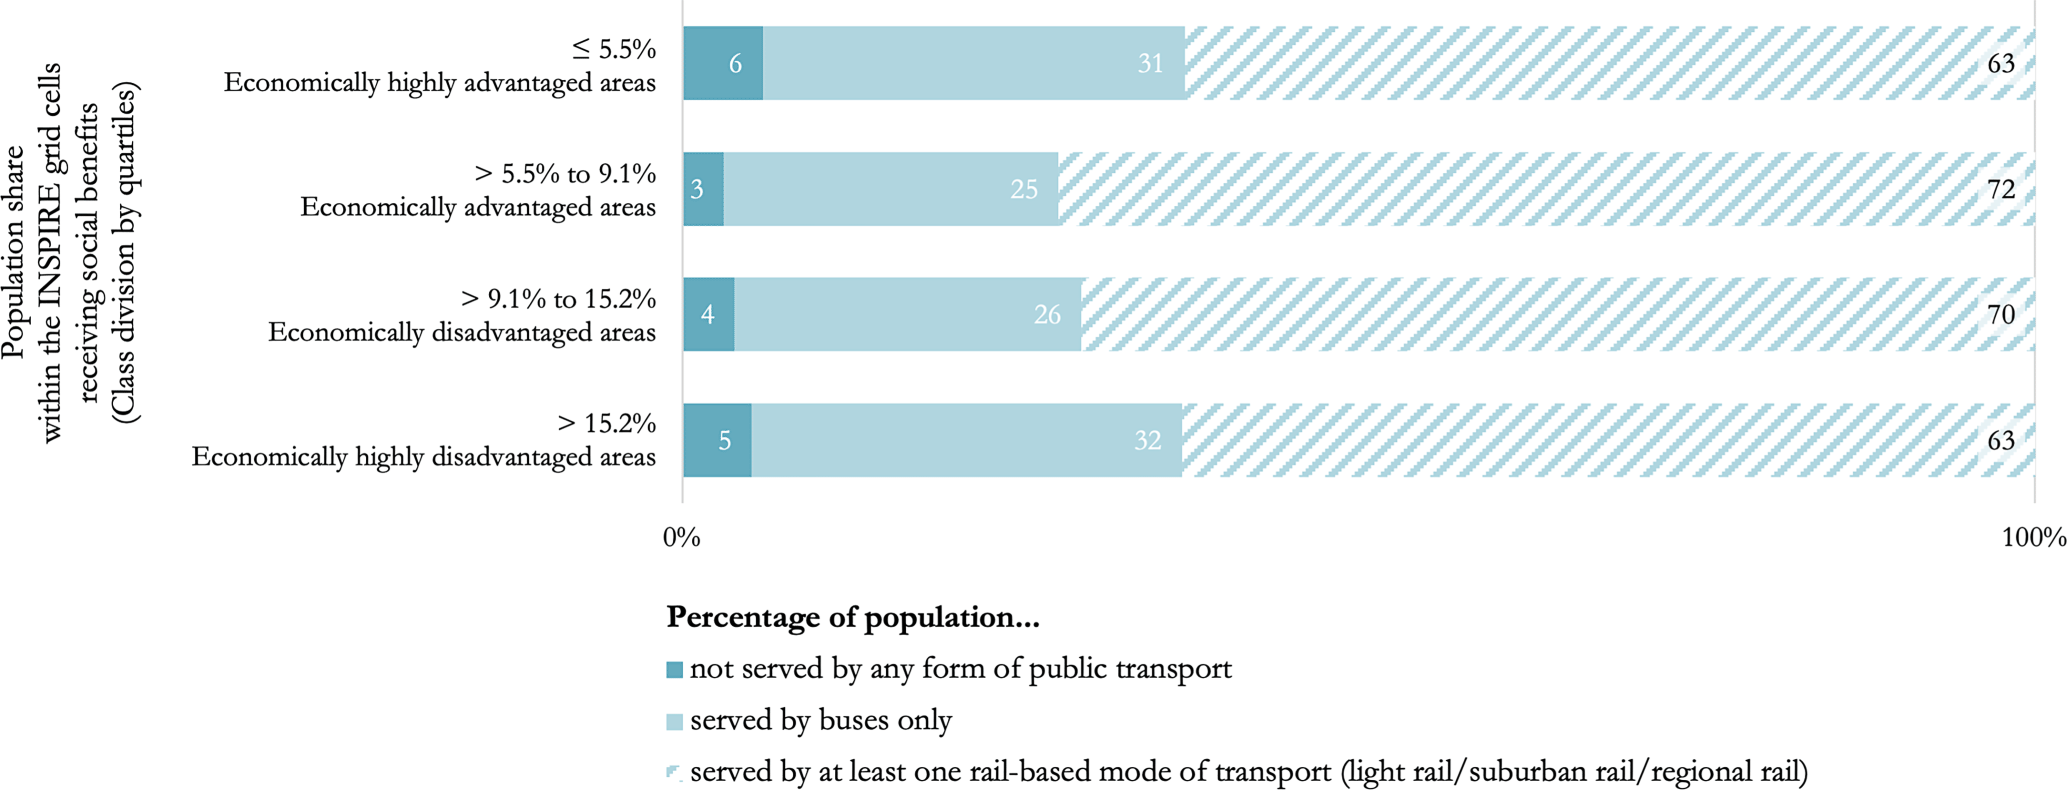
The results from the correlation between public transport provision and the proportion of social benefit recipients showed that areas with a high proportion of social benefit recipients were not structurally disadvantaged in terms of public transport provision. The pure availability status of public transport was highest in areas with a slightly below-average proportion of social benefits recipients and decreased slightly as the proportion of social benefit recipients increased. However, the areas that were most frequently not served by any public transport were those with a significantly below-average proportion of social benefit recipients, making it impossible to identify a clear trend. Aberle, Daubitz and Schwedes (2025: 7) came to similar conclusions in their analysis of spatial patterns of mobility-related exclusion in Berlin and Hamburg: people living on welfare in Berlin were minimally more likely to be excluded from public transport than the Berlin average, but the difference was minimal; for Hamburg, the opposite was the case.
Delbosc and Currie (2011: 1256) show that public transport services in Melbourne are very unevenly distributed overall: over 70 % of the population receive only 19 % of available public transport. In terms of income classes, low-income residents in inner-city areas benefit more than average from public transport, as this is where the service is concentrated. In central and outer city locations, however, poor households are sometimes significantly underserved, especially if they are not located within well-connected corridors. Thus, a systematic favouring of low-income groups cannot be deduced from this study. Instead, side effects of the urban structure have positive effects for the socially disadvantaged (Delbosc/Currie 2011: 1257–1259).
In contrast, El-Geneidy, Levinson, Diab et al. (2016: 302) find that residents of socially disadvantaged areas in Montreal benefit from more equitable accessibility to jobs using public transport than other groups in the region, even when considering the financial implications of fare costs.
In regard to the public transport provision and economic status, the distribution of absolute public transport departures corresponds most closely to the utilitarian distribution curve, which is characterised by maximum accessibility independent of income and thus provides the greatest possible benefit for all income classes, due to non-existent or weakly positive correlations (Adli/Chowdhury/Shiftan 2019: 90; see Figure 1).
The relative public transport departures also correspond to the sufficientarist approach, as relative public transport provision increases with increasing affluence. However, in the context of high residential densities, where disadvantaged groups are often situated, elements of an egalitarian curve would be desirable for reasons of transport capacity and the frequent dependence of disadvantaged people on public transport. In line with the findings of Aberle/Daubitz/Schwedes (2025) and Delbosc/Currie (2011), no egalitarian distribution curve (“vertical equity” by Delbosc/Currie 2011: 1252, 1256) was found in the Cologne study area. It can therefore be assumed that the distribution of public transport primarily follows functional and economic principles rather than social criteria. Collins, Der Wartanian, Reed et al. (2023: 6) confirm this for southern California and note that before the coronavirus pandemic, there was a strong correlation between poor public transport provision, social disadvantage and ethnic composition. During the pandemic, this inequality was reduced by a stronger focus on disadvantaged urban areas, including the supply of essential workers, before returning to its original state after the pandemic (Collins/Der Wartanian/Reed et al. 2023: 8). Their model shows that racially and socially disadvantaged groups are systematically worse served by public transport – except in exceptional phases such as the pandemic. To address this structural issue, the expansion of public transport would have to specifically address the needs of structurally disadvantaged groups and peripheral areas in order to distribute mobility opportunities in a more resilient, sustainable and fair manner.
In terms of the absolute number of departures differentiated by specific means of transport, the analysis shows that bus services in particular and, to a lesser extent, regional rail services in Cologne increase as the share of social benefit recipients rises. This reflects the egalitarian curve with a stronger provision for economically disadvantaged groups. Only for light rail services, an almost opposite, though weak, trend is observed. Aberle, Daubitz and Schwedes (2025: 7) also confirm that rail-based transport is less available to lower-income groups in Berlin than to others, therefore following an opposite and sufficientarist curve with a preference for higher-income groups.
While the findings of Aberle, Daubitz and Schwedes (2025: 5–7) for Berlin and Hamburg only partially confirm the observations on the absolute distribution of different means of public transport in Cologne, all results showed that the number of relative public transport departures per inhabitant decreased for all means of transport with increasing financial disadvantage. This is probably because financially disadvantaged people, particularly in large cities, often live in high-density neighbourhoods (Beckmann/Bracher/Hesse 2007: 15), which has a negative impact on the relative number of public transport departures per inhabitant. Examples, like the district of Vingst with more than 11,000 inhabitants per square kilometre, show that a high population density can lead to below-average relative public transport provision, even when the absolute public transport provision is above average; this can manifest in the form of fuller stations and vehicles (Daubitz/Aberle 2020: 6; online supplementary material C). Evidently, the provision of quantitatively satisfactory public transport does not necessarily guarantee its suitability in qualitative terms.
The literature focuses mostly on general public transport accessibility and not on quality of transport. Nonetheless, Daubitz and Aberle (2020: 4) state that rail transport is a higher-quality mode and poorer access can lead to mobility-related disadvantages. However, buses and light rails might better meet the needs of socially disadvantaged people (Aberle/Daubitz/Schwedes 2025: 10).
Bus routes in Cologne act as feeders for large parts of the network without direct city centre connections and are mainly disadvantaged in times of travel speed. This structure is reflected in many risk clusters. For example, Kalk-Nord had slightly below-average absolute public transport supply. High population density negatively affected the relative public transport provision. Despite 75 % public transport coverage, the area was served only by buses, whose lower weighting led to a comparatively poor service value. Similarly, in several risk clusters on both sides of the Rhine – such as Stammheim, Flittard and Lindweiler – public transport consisted almost exclusively of buses without transfer-free city centre connections. As a short-term remedy, a planned express bus network in Cologne may optimise public transport services and increase bus attractiveness in areas which are not yet served by rail (Stadt Köln 2017: 215). Express buses can create new direct city centre connections with fewer stops and shorter travel times. Such accelerated bus connections are already used in several major German cities such as Düsseldorf or Hamburg.
The results of the bivariate correlation analysis showed that all bivariate combinations of characteristics were equally present in the study area and that there was no structural under- or over-supply of public transport in areas with an above- or below-average proportion of the population receiving social benefits. However, around 23 % of the inhabited area was characterised by a critical combination of below-average public transport provision and an above-average proportion of the population receiving social benefits, affecting around 21 % of the total population of the Cologne study area (see Table 3).
A comparison of the spatial clusters identified as having an increased potential risk of mobility-related social exclusion with the “social spaces” (authors’ translation), mentioned in a framework concept (Stadt Köln 2010: 17) showed large overlaps. These “social spaces” were “based on the ‘social situation’ index and include the economic, political-cultural and health aspects of disadvantage”13 (authors’ translation). A “settlement-spatial classification [and description] of historical genesis and function” (Stadt Köln 2015: 23, authors’ translation) carried out in this context showed that the economic, political-cultural and health-related disadvantage structures focus primarily on three urban fabric types, into which a large proportion of the risk clusters identified in this study could also be classified. Examples include the clusters of the Mülheim, Kalk and Humboldt districts (Gründerzeit industrialised suburban belt), clusters of the Buchheim, Gremberghoven and Bilderstöckchen districts (suburban belt of the interwar period), and the Chorweiler Nord and Seeberg Nord clusters (high rise/large estate districts). The large proportion of overlaps indicates that the potential risk of mobility-related social exclusion identified in most cases is accompanied by other problems characteristic of these types of urban fabric, illustrating the interaction between transport and economic, cultural and health aspects as well as employment and education (Beckmann/Bracher/Hesse 2007: 11; Daubitz 2011: 183). This can thus be embedded in explanations on the structural disadvantage of neighbourhoods.
The results of a nationwide comparison of public transport ticket prices showed that public transport in Cologne was among the most expensive (Bukow/Meinefeld/Schmidt 2020: 20). In low-income population groups, transport expenditure accounts for an excessively high share of disposable income. In terms of the Bürgergeld (former Hartz IV) standard rate and transport costs of € 50.49 provided in 2025 (€ 40.01 in 2021), the concessionary social tickets can be understood as an approximation of the available budget of the people concerned. These concessions are no guarantee for actual affordability, and such offers do not guarantee the individual will of those affected to realise their mobility needs (Daubitz 2021: 82–83).
In contrast, the debate on the introduction of free use of public transport offers the prospect of reducing or completely removing financial barriers to accessing public transport (Cats/Susilo/Reimal 2017; Andor/Fink/Frondel et al. 2020; Kębłowski 2020). In European cities such as Luxembourg (Carr/Hesse 2020: 2) or Tallinn (Sträuli 2024: 686), but also in German cities such as Monheim am Rhein14 (see Stadt Monheim am Rhein 2022), public transport is already free of charge. In Germany, the “9-Euro-Ticket”15 introduced in summer 2022 provided users with unprecedented access to public transport services nationwide for just € 9 per month. For low-income earners, this temporary offer represented a substantial increase in mobility, providing financial relief and straightforward conditions (Hille/Gather 2022: 2). The Deutschlandticket, the successor to the 9‑Euro-Ticket, cost € 49 per month initially and increased to € 58 in 2025. It has enabled the continued use of public transport in an easy and tariff-simplified manner. However, the financial relief it provides is limited (Hille/Gather 2022: 27), considering that the price is almost equivalent to the full € 50.49 Bürgergeld expenditure rate on transport.
As part of the merging of input data at the level of INSPIRE raster cells, data from 570 statistical neighbourhoods was disaggregated to around 13,000 cells. Compared to the significantly larger and more heterogeneous 86 Cologne districts, these neighbourhoods are more socio-spatially homogeneous due to their population size and geometry based on settlement structure (Stadt Köln 2021; Stadt Köln 2022). Since many other complex conditions must be met before a (high) risk cluster can be identified, individual inaccuracies have minimal impact on the global results.
Furthermore, the GIS analysis is based on public transport quality using simple, objectively measurable parameters. These measure objective accessibility, without accounting for actual destination relevance or public transport service usability. In addition, social status, as a result of social inequality and disadvantage, is not only measurable via economic indicators, but also via, e.g., health-related, cultural-related dimensions.
As the collective potential risk of mobility-related social exclusion of a raster cell cannot be assigned to individuals to avoid ecological fallacy (de Lange/Nipper 2018: 158–159), the data was interpreted at the spatial unit level. The potential risk of mobility-related social exclusion values reflects the probability that individuals within a cell may be affected and does not reflect a specific risk to each resident.
Despite its relevance, the social and subjective dimension of mobility exclusion has so far received little attention in local political consideration and transport planning (Daubitz 2011: 181), or in mobility-related social reporting (Hausigke/Kruse 2021: 270). A qualitative perspective, involving citizens, local experts and initiatives, would complement quantitative data with subjective insights and allow unequal political participation and the neglected interests of disadvantaged groups to be considered (Böhnke/Groh-Samberg/Kleinert 2023: 62).
The analysis provides a comprehensive and spatially high-resolution overview of the spatial distribution of public mobility provision and the economic status of the population in the Cologne study area, placing both dimensions in a spatial context with each other and in a contextual relationship with the concept of social exclusion.
A central finding of the bivariate analysis of the correlation between public transport provision and the proportion of the population receiving social benefits is that people in economically weaker areas of Cologne are not exposed to structurally lower public transport provision, although slight differences are discernible regarding the distribution of specific means of transport. However, considering the number of public transport departures in relation to the number of inhabitants living in the catchment area of these departures, the relative number of departures by all means of transport decreases as the proportion of the population receiving social benefits increases, resulting in fuller stations and vehicles. The high-resolution results also show that 23.5 % of the population in the study area are affected by a high potential risk of mobility-related social exclusion and a further 7.5 % by a very high potential risk of mobility-related social exclusion. Considering only those who receive social benefits, 44.4 % live in areas with a high potential risk of mobility-related social exclusion and 12.6 % in areas with a very high potential risk of mobility-related social exclusion, which indicates that this vulnerable part of the population has a significantly stronger exposure to a potential risk of mobility-related social exclusion. A total of 49 spatial risk clusters are concentrated in the city area, particularly in the districts on the right bank of the River Rhine. The Innenstadt and Lindenthal districts on the left riverbank have no risk clusters. High population densities and low car ownership in the affected areas increase the negative impact of the below-average public transport provision, which also worsens the relative number of public transport departures per inhabitant.
A high degree of spatial overlap with well-known “problem areas” in the study area underlines that the mobility-related inequalities examined are often embedded in a broader context of disadvantage related to social and settlement structures and that an integrative approach to identifying sustainable solutions is necessary.
In line with the results of other case studies (as mentioned in Section 6.1), the distribution of public transport often primarily follows functional and economic principles rather than social criteria. Other case studies show that socially disadvantaged population groups can also have structurally better access to public transport (see Section 6.1).
Due to the high spatial resolution of the results, this comprehensive socio-spatial analysis allows intra-municipal comparison and thus creates awareness of mobility-related disadvantage structures in the study area. In combination with future further studies, including the qualitative recording of subjective perceptions to complement the objectively determined disadvantage structures, this research can provide an initial basis for the sustainable improvement of corresponding grievances in the previously underrepresented social process of mobility-related exclusion.
References
| Aberle, C.; Daubitz, S.; Schwedes, O.; Gertz, C. (2025): Measuring transport poverty with a mixed methods approach. A comparative case study of the German cities Berlin and Hamburg. In: Journal of Transport Geography 125, 104140. https://doi.org/10.1016/j.jtrangeo.2025.104140 |
| Adli, S.N.; Chowdhury, S.; Shiftan, Y. (2019): Justice in public transport systems: A comparative study of Auckland, Brisbane, Perth and Vancouver. In: Cities 90, 88–99. https://doi.org/10.1016/j.cities.2019.01.031 |
| Andor, M.A.; Fink, L.; Frondel, M.; Gerster, A.; Horvath, M. (2020): Kostenloser ÖPNV: Akzeptanz in der Bevölkerung und mögliche Auswirkungen auf das Mobilitätsverhalten. In: List Forum für Wirtschafts- und Finanzpolitik 46, 3, 299–325. https://doi.org/10.1007/s41025-020-00207-y |
| Beckmann, K.J.; Bracher, T.; Hesse, M. (2007): Mobilität und benachteiligte Stadtquartiere im Fokus integrierter Stadtentwicklungspolitik. In: Deutsche Zeitschrift für Kommunalwissenschaften 46, 2, 9–22. |
| BMVI – Bundesministerium für Verkehr und digitale Infrastruktur (2016): Standardisierte Bewertung von Verkehrswegeinvestitionen im schienengebundenen öffentlichen Personennahverkehr. Berlin. |
| Böhme, C.; Franke, T.; Preuß, T. (2019): Umsetzung einer integrierten Strategie zu Umweltgerechtigkeit – Pilotprojekt in deutschen Kommunen. Berlin. = Umwelt & Gesundheit 02-2019. |
| Böhnke, P.; Groh-Samberg, O.; Kleinert, C. (2023): Folgen sozialer Ungleichheit. In: Informationen zur politischen Bildung 354, 60–67. |
| Bortz, J.; Döring, N. (2006): Forschungsmethoden und Evaluation für Human- und Sozialwissenschaftler. Berlin. https://doi.org/10.1007/978-3-540-33306-7 |
| Bukow, S.; Meinefeld, O.; Schmidt, R. (2020): Infrastrukturatlas 2020. Daten und Fakten über öffentliche Räume und Netze. Berlin. |
| Bundesagentur für Arbeit (2021): Daten der Leistungen nach SGB II und Arbeitslosenquote je statistisches Quartier (December 2020). Nürnberg. |
| Carr, C.; Hesse, M. (2020): Mobility policy through the lens of policy mobility: The post-political case of T introducing free transit in Luxembourg. In: Journal of Transport Geography 83, 102634. https://doi.org/10.1016/j.jtrangeo.2020.102634 |
| Cass, N.; Shove, E.; Urry, J. (2005): Social Exclusion, Mobility and Access. In: The Sociological Review 53, 3, 539–555. https://doi.org/10.1111/j.1467-954X.2005.00565.x |
| Cats, O.; Susilo, Y.O; Reimal, T. (2017): The prospects of fare-free public transport: evidence from Tallinn. In: Transportation 44, 5, 1083–1104. https://doi.org/10.1007/s11116-016-9695-5 |
| Church, A.; Frost, M.; Sullivan, K. (2000): Transport and social exclusion in London. In: Transport Policy 7, 3, 195–205. https://doi.org/10.1016/S0967-070X(00)00024-X |
| Cohen, J. (1988): Statistical Power Analysis for the Behavioral Sciences. Hillsdale. |
| Collins, K.; Der Wartanian, R.; Reed, P.; Chea, H.; Hou, Y.; Zhang, Y. (2023): Social equity and public transit in the inland empire: Introducing a transit equity analysis model. In: Transportation Research Interdisciplinary Perspectives 21, 100870. https://doi.org/10.1016/j.trip.2023.100870 |
| Daubitz, S. (2011): Mobilität und Armut – Die soziale Frage im Verkehr. In: Schwedes, O. (ed.): Verkehrspolitik. Eine interdisziplinäre Einführung. Wiesbaden, 181–194. https://doi.org/10.1007/978-3-531-92843-2_9 |
| Daubitz, S. (2021): Teilhabe und Öffentliche Mobilität: Die Rolle der Politik. In: Schwedes, O. (ed.): Öffentliche Mobilität. Voraussetzungen für eine menschengerechte Verkehrsplanung. Wiesbaden, 77–101. https://doi.org/10.1007/978-3-658-32106-2_4 |
| Daubitz, S.; Aberle, C. (2020): Faktenblatt. Mobilität und Soziale Exklusion in Berlin. Berlin. https://doi.org/10.15480/882.3020 |
| Daubitz, S.; Aberle, C.; Schwedes, O.; Gertz, C. (2023): Mobilität und soziale Exklusion. Berlin. = Mobilität und Gesellschaft 10. https://doi.org/10.52038/9783643250452 |
| de Lange, N.; Nipper, J. (2018): Quantitative Methodik in der Geographie. Paderborn. |
| Delbosc, A.; Currie, G. (2011): Using Lorenz curves to assess public transport equity. In: Journal of Transport Geography 19, 6, 1252–1259. https://doi.org/10.1016/j.jtrangeo.2011.02.008 |
| El-Geneidy, A.; Levinson, D.; Diab, E.; Boisjoly, G.; Verbich, D.; Loong, C. (2016): The cost of equity: Assessing transit accessibility and social disparity using total travel cost. In: Transportation Research Part A: Policy and Practice 91, 302–316. https://doi.org/10.1016/j.tra.2016.07.003 |
| Fischer, A.; Rozynek, C.; Henkel, F.; Sommer, C. (2024): Forschungsstand und Konzepte zum Zusammenhang zwischen Mobilität und sozialer Exklusion. In: Sommer C.; Lanzendorf, M.; Engbers, M.; Wermuth, T. (eds.): Soziale Teilhabe und Mobilität. Wiesbaden, 17-41. https://doi.org/10.1007/978-3-658-42536-4_3 |
| FGSV – Forschungsgesellschaft für Straßen- und Verkehrswesen (2015): Hinweise zu Mobilität und sozialer Exklusion. Forschungsstand zum Zusammenhang von Mobilitäts- und Teilhabechancen. Köln. |
| Hammer, A.; Scheiner, J. (2006): Lebensstile, Wohnmilieus, Raum und Mobilität – der Untersuchungsansatz von StadtLeben. In: Beckmann, K.J.; Hesse, M.; Holz-Rau, C.; Hunecke, M. (eds.): StadtLeben – Wohnen, Mobilität und Lebensstil. Wiesbaden, 15–30. https://doi.org/10.1007/978-3-531-90132-9_2 |
| Hausigke, S.; Kruse, C. (2021): Öffentliche Mobilität gestalten. Die Mobilitätsberichterstattung. In: Schwedes, O. (ed.): Öffentliche Mobilität. Voraussetzungen für eine menschengerechte Verkehrsplanung. Wiesbaden, 269–300. https://doi.org/10.1007/978-3-658-32106-2_11 |
| Henkel, F.; Sommer, C. (2024): Entwicklung eines Index zur Quantifizierung von Mobilitätsoptionen. In: Sommer C.; Lanzendorf, M.; Engbers, M.; Wermuth, T. (eds.): Soziale Teilhabe und Mobilität. Wiesbaden, 149–183. https://doi.org/10.1007/978-3-658-42536-4_7 |
| Hille, C.; Gather, M. (2022): „Das 9‑Euro-Ticket hat mir gezeigt, dass man nicht alleine sein muss.“ – Mit dem 9‑Euro-Ticket zu mehr sozialer Teilhabe? Erfurt. = Berichte des Instituts Verkehr und Raum 29. |
| Kębłowski, W. (2020): Why (not) abolish fares? Exploring the global geography of fare-free public transport. In: Transportation 47, 6, 2807–2835. https://doi.org/10.1007/s11116-019-09986-6 |
| Kenyon, S.; Lyons, G.; Rafferty, J. (2002): Transport and social exclusion: investigating the possibility of promoting inclusion through virtual mobility. In: Journal of Transport Geography 10, 3, 207–219. https://doi.org/10.1016/S0966-6923(02)00012-1 |
| KVB – Kölner Verkehrs-Betriebe (2021): Geschäftsbericht 2020. Wo Zukunft Stadt findet. Köln. |
| Kronauer, M. (2009): Die Innen-Außen-Spaltung der Gesellschaft. Eine Verteidigung des Exklusionsbegriffs gegen seinen mystifizierenden Gebrauch. In: Solga, H.; Powell, J.; Berger, P.A. (eds.): Soziale Ungleichheit. Klassische Texte zur Sozialstrukturanalyse. Frankfurt am Main, 375–383. |
| Le Goix, R. (2022): Socio-spatial Segregation in Cities. In: Cottineau, C., Pumain, D. (eds.): Cities at the Heart of Inequalities. London: 137–172. https://doi.org/10.1002/9781119986812.ch5 |
| Liao, Y.; Gil, J.; Yeh, S.; Pereira, R.H.M.; Alessandretti, L. (2025): Socio-spatial segregation and human mobility: A review of empirical evidence. In: Computers, Environment and Urban Systems 117, 102250. https://doi.org/10.1016/j.compenvurbsys.2025.102250 |
| Lucas, K. (2012): Transport and social exclusion: Where are we now? In: Transport Policy 20, 105–113. https://doi.org/10.1016/j.tranpol.2012.01.013 |
| Lucas, K.; Mattioli, G.; Verlinghieri, E.; Guzman, A. (2016): Transport poverty and its adverse social consequences. In: Transport 169, 6, 354–365. https://doi.org/10.1680/jtran.15.00073 |
| Nelson, R.; Warnier, M.; Verma, T. (2024): Conceptualizing Urban Inequalities as a Complex Socio-Technical Phenomenon. In: Geographical Analysis 56, 2, 187–216. https://doi.org/10.1111/gean.12373 |
| Nicoletti, L.; Sirenko, M.; Verma, T. (2023): Disadvantaged communities have lower access to urban infrastructure. In: Environment and Planning B: Urban Analytics and City Science 50, 3, 831–849. https://doi.org/10.1177/23998083221131044 |
| Nobis, C.; Kuhnimhof, T. (2019): Mobilität in Deutschland. MiD Ergebnisbericht, im Auftrag des Bundesministers für Mobilität und digitale Infrastruktur. Bonn. |
| Rozynek, C.; Schwerdtfeger, S.; Lanzendorf, M. (2020): Über den Zusammenhang von sozialer Exklusion und Mobilität. Konzeptionelle Überlegungen zur Einrichtung eines Reallabors in der Region Hannover. Frankfurt am Main. = Arbeitspapiere zur Mobilitätsforschung 23. |
| Runge, D. (2005): Mobilitätsarmut in Deutschland? Berlin. = IVP-Schriften 6. |
| Schnieder, L. (2015): Betriebsplanung im öffentlichen Personennahverkehr. Berlin. https://doi.org/10.1007/978-3-662-46456-4 |
| Schwanen, T.; Lucas, K.; Akyelken, N.; Cisternas Solsona, D.; Carrasco, J.-A.; Neutens, T. (2015): Rethinking the links between social exclusion and transport disadvantage through the lens of social capital. In: Transportation Research Part A: Policy and Practice 74, 1, 123–135. https://doi.org/10.1016/j.tra.2015.02.012 |
| Schwedes, O.; Daubitz, S.; Rammert, A.; Sternkopf, B.; Hoor, A. (2018): Kleiner Begriffskanon der Mobilitätsforschung. Berlin. = IVP Discussion Paper 2018‑1. |
| Schwerdtfeger, S. (2019): Fahren ohne (gültigen) Fahrschein. Motive, soziale Akzeptanz und alternative Finanzierungsinstrumente. Wiesbaden. https://doi.org/10.1007/978-3-658-26064-4 |
| SSP Consult (2021): Bevölkerung je Rasterzelle (December 2020). Köln. |
| Stadt Köln (2010): Beschlussvorlage 0476/2010. Rahmenkonzept „Lebenswerte Veedel – Bürger- und Sozialraumorientierung in Köln“. Anlage Rahmenkonzept. Köln. https://ratsinformation.stadt-koeln.de/vo0050.asp?__kvonr=21216&voselect=4313 (29.09.2025). |
| Stadt Köln (2014): Köln mobil 2025. Köln. |
| Stadt Köln (2015): Starke Veedel – Starkes Köln. Integriertes Handlungskonzept. Köln. |
| Stadt Köln (2017): 3. Nahverkehrsplan. Köln. |
| Stadt Köln (2021): Statistische Quartiere Köln. https://www.offenedaten-koeln.de/dataset/statistische-quartiere-köln (26.09.2025). |
| Stadt Köln (2022): Die Kommunale Gebietsgliederung. Ein räumlicher Bezug für statistische Daten. Köln. |
| Stadt Köln (2023): Stadtstrategie 2.0 „Kölner Perspektiven 2030+“. Köln. |
| Stadt Köln (2024): Statistisches Jahrbuch 2023. Köln. = Kölner Statistische Nachrichten 9/2024. |
| Stanley, J.K.; Hensher, D.A.; Stanley, J.R. (2022): Place-based disadvantage, social exclusion and the value of mobility. In: Transportation Research Part A: Policy and Practice 160, 101–113. https://doi.org/10.1016/j.tra.2022.04.005 |
| Sträuli, L. (2024): Fare-free, not carefree: care mobilities in a fare-free public transport system in Tallinn. In: Mobilities 19, 4, 686–703. https://doi.org/10.1080/17450101.2024.2328215 |
| van Ham, M.; Tammaru, T.; Ubarevičienė, R.; Janssen, H. (eds.) (2021): Urban Socio-Economic Segregation and Income Inequality. A Global Perspective. Cham. https://doi.org/10.1007/978-3-030-64569-4 |
| van Gent, W.; Hochstenbach, C. (2020): The impact of gentrification on social and ethnic segregation. In: Musterd, S. (ed.): Handbook of Urban Segregation. Cheltenham, 306–324. |
| Ward, C.; Walsh, D. (2023): “I just don’t go nowhere:” How transportation disadvantage reinforces social exclusion. In: Journal of Transport Geography 110, 103627. https://doi.org/10.1016/j.jtrangeo.2023.103627 |
Footnotes
| 1 | The definition of mobility used in the context of this paper only includes short-term and spatial mobility (everyday spatial mobility) according to Hammer and Scheiner (2006: 19). Extended definitions, such as long-term spatial mobility or social mobility, are explicitly not part of the definition used here. |
| 2 | https://www.kvb.koeln/unternehmen/ (26.09.2025). |
| 3 | Since 2023 the allowance “Hartz IV” has been renamed “Bürgergeld”. |
| 4 | QGIS Geographic Information System, Version 13.16.7; https://www.qgis.org/ (26.09.2025). |
| 5 | Relational database management system PostgreSQL, Version 13; https://www.postgresql.org/ (26.09.2025). |
| 6 | On-demand bus routes (Anrufsammeltaxi, Rufbus) operate on fixed routes with fixed stops with a fixed timetable. However, customers must actively register for these departures, in order to have a vehicle be sent out. |
| 7 | Asylbewerberleistungsgesetz (AsylbLG) in the version published on 5 August 1997 (BGBl. I: 2022), last amended by Article 8(3) of the Act of 23 December 2024 (BGBl. 2024 I No. 449). |
| 8 | In contrast to the aforementioned on-demand bus routes (Anrufsammeltaxi, Rufbus), during the time of research, ISI operated in a designated service area without assigned routes, stops or timetables. An algorithm effectively compiles the journeys by bundling journey requests. |
| 9 | https://www.kvb.koeln/mobilitaet/isi/index.html (26.09.2025). |
| 10 | At the time of research, a second and station-based zone for KVB Bike in the outer areas of the city was being developed. It was therefore not considered in the data analyses. |
| 11 | The nighttime service area was not considered, as it required a surcharge and therefore fell into the category of paid additional mobility services (mostly provided by private companies) that were not included in the analysis. |
| 12 | https://gdz.bkg.bund.de/index.php/default/open-data/geographische-gitter-fur-deutschland-in-lambert-projektion-geogitter-inspire.html (26.09.2025); authors’ translation. |
| 13 | https://www.stadt-koeln.de/artikel/66131/index.html (29.09.2025). |
| 14 | https://www.monheim.de/stadtleben-aktuelles/stadtprofil/oeffentlicher-personennahverkehr (29.09.2025). |
| 15 | The € 9 ticket and the Germany-wide ticket were not yet available when the GTFS data was collected. |