
As a key element of the welfare state, service provision (Krings 2020) is currently gaining political relevance, especially in the discourse on deprived regions (abgehängte Regionen) that lack or are considered to lack sufficient service provision (Weingarten/Steinführer 2020: 654). Service provision (Daseinsvorsorge) encompasses those services of particular public interest (Einig 2008: 17). The service facilities are provided and run by public, private and welfare-oriented actors (Weingarten/Steinführer 2020: 656). For spatial planning, a key task is to ensure the strategic location of public facilities within a network of cities and towns, thus providing access (Zugänglichkeit) to them for the population (Seisenberger/Reiter 2022: 218). Hence, planning requires knowledge and objectives on national guidelines, regional provision and local access.
It is important to distinguish between different forms of access to services, as often the term accessibility is used in a similar way. In broader terms, accessibility refers to the physical ability to reach a service or the expenses linked to doing so, e.g. travel distance or costs (see Neumeier/Osigus 2024 for a conceptual overview). Penchansky and Thomas (1981: 128) define the broader concept of access as a “degree of fit” between the clients (the general population) and service providers (e.g., hospitals, doctors, clinics) in a healthcare system. According to their definition, accessibility is one of five dimensions of access, which also include availability, accommodation, affordability and acceptability. Regarding spatial planning, accessibility and availability stand out as the more influential dimensions of access (Khan/Bhardwaj 1994; Guagliardo 2004: 2). In this context, accessibility describes only whether a service facility can be reached in a certain amount of travel time or not, whereas availability refers to the capacity of a service a person can utilize at a particular facility. In this paper, we analyse accessibility as well as availability of services, which is why the overarching term access is used to describe both dimensions at the same time.
Access to health services, with medical facilities as a key element, is considered a corner stone of service provision (Steinführer 2015; Krings 2020). But demographic changes and labour shortages pose challenges to ensuring service provision in both rural and growing urban areas (for media coverage see e.g. Nützel 2023; Olivares/Kohler 2023). As a point in case, access to primary care physicians (Hausarzt) in rural areas follows current demographic shifts. In contrast, rapidly growing urban agglomerations face rising demand and limited capacities to adapt. Both dynamics challenge the welfare state’s role in facilitating equivalent living conditions (Gleichwertige Lebensverhältnisse). Subsequent concerns and fears of deprivation are leading to a strong public and academic debate (Weingarten/Steinführer 2020: 653), which also has great implications for spatial planning in both rural and urban settings, demanding solutions for future service provision. However, despite such engaged debate, there is a lack of broadly available spatial information on the status and change of access to service provision. Hence, new approaches are needed for an informed debate on current local, regional and national trends with the aim to develop policy measures (Seisenberger/Pajares/Hecht et al. 2023: 128).
Current research focuses on the crucial aspect of access/accessibility to medical facilities (Stentzel/Piegsa/Fredrich et al. 2016; Bauer/Maier/Müller et al. 2018; Jörg/Lenz/Wetz et al. 2019; Tali/Nazir/Ul Shafiq 2022). To evaluate spatial access to medical facilities, gravity-based models are used to map the interplay of accessibility and availability. Two conceptual developments have emerged for this purpose (Stacherl/Sauzet 2023: 4): the Two-Step Floating Catchment Area (2SFCA) method and the Kernel Density (KD) method. The 2SFCA method and the enhanced version of it (the so-called E2SFCA) are well-established ways of measuring spatial access to all sorts of facilities, especially in medical service provision including primary care physicians (Luo/Qi 2009; McGrail/Humphreys 2009; Langford/Higgs/Fry 2016; Tali/Nazir/Ul Shafiq 2022). One disadvantage of using the E2SFCA method is that competition on the supply side is not considered (Wan/Zou/Sternberg 2012; Chen/Chen/Lan et al. 2023). Also, these approaches to analyse the supply and demand of medical services face particular challenges concerning data availability (Pajares/Büttner/Jehle et al. 2021; Seisenberger/Pajares/Hecht et al. 2023). There is also an implicit gap between modelled and perceived spatial access to medical services (Baier/Pieper/Schweikart et al. 2020: 1), which calls for greater sensitivity in planning.
For medical care in Germany, the legal definition of demand is based on the ratio of inhabitants per physician or medical specialist within an administrative area (Krügel/Mäs 2023: 2). Krügel and Mäs (2023) also point out that there is a general risk that the predefined administrative zones for formal demand planning do not match the daily needs of changing populations within actual settlement structures. Furthermore, when it comes to describing supply and demand spatially, relevant information on various scales, i.e. from local individual access to regional administrative zones and national policy making, is not available. While specific solutions for data have been tested, an overall national approach that could also provide constant monitoring is not available. GIS tools may be a possible solution to fill this gap (Seisenberger/Pajares/Hecht et al. 2023: 128).
Describing and monitoring access to facilities requires data for three elements of access: information on spatial connectivity via transport infrastructure, changes in population distribution, and the location and capacity of medical facilities. Analysing these elements at a national scale poses challenges, as authoritative micro-scale population data in Germany (e.g. census data) is infrequently updated. To overcome this limitation, a viable solution to generate synthetic population data is offered by micro-scale population estimates utilizing dasymetric mapping techniques that incorporate building data (Hecht/Herold/Behnisch et al. 2019: 2; Schug/Frantz/van der Linden et al. 2021: 2; Reiter/Jehling/Hecht 2023: 1). However, data on medical facilities is available only on request, as information on their location and capacity is subject to data privacy regulations. Following the conclusions of Neumeier (2016: 357), it is crucial to provide an approach capable of addressing these challenges that provides small-scale spatial information for stakeholders in medical and spatial planning and the general public.
This study aims to apply a geospatial approach to enhance spatial knowledge for service provision planning, focusing on mapping at the different scales relevant for planning and analysis. Primary care physicians are used as a case study. We ask the following research questions: How can population dynamics be estimated at an appropriate spatial scale to measure changes in demand? How can access to medical facilities be mapped? Which spatial patterns and trends emerge for medical service provision in Germany? As a key element, the study demonstrates a method for estimating population change on a micro-scale. Utilizing obtained official data on primary care physician capacities, an access measure is applied to describe spatial trends in service provision in Germany.
The paper is organized as follows. First, we introduce our artificial intelligence (AI)-based micro-scale population estimation method and our approach to access mapping, considering relevant research in spatial and transportation planning. Subsequently, we present results through a series of maps illustrating changes in supply, demand and access to medical services from 2011 to 2022, which we reflect on subsequently in the discussion.
The methods are divided into two main parts. To begin with, we introduce the data and software used in Section 2.1. Then, we describe how we model the missing demand side for the current state of 2022 by estimating population data at the micro level with national coverage (Section 2.2). Based on the latest available census data from 2011 and the building model from the same year, an AI-based model is trained that predicts the current population based on a building model from 2022. Following this, we proceed with the actual access mapping, analysing the relationship between the supply side (exemplified by primary care physicians) and the previously modelled demand side (Section 2.3). For this purpose, we chose to apply a gravity-based model from the Two-Step Floating Catchment Area (2SFCA) method family, which is very commonly used in spatial healthcare analysis (Stacherl/Sauzet 2023: 19). Lastly, in Section 2.4 we briefly introduce the spatial typology used for analysis.
Dataset | Spatial resolution | Availability | Reference |
|---|---|---|---|
Official Census | 100m grid | 2011 | Statistische Ämter des Bundes und der Länder (2018) |
Building footprints (HU-DE) | Individual 2D building shapes | 2011, 2022 (not released) | Bundesamt für Kartographie und Geodäsie (2012b) |
Address points (HK-DE) | Point data | 2011, 2022 (not released) | Bundesamt für Kartographie und Geodäsie (2012a) |
LoD2 buildings (LoD2-DE) | Individual 3D building shapes | 2022 (not released) | Bundesamt für Kartographie und Geodäsie (2021) |
Physician locations | Point data | 2011, 2022 (not released) | Kassenärztliche Bundesvereinigung (KBV) (2023) |
OSM road network | Line data | Snapshot 17.11.2022 | OpenStreetMap Contributors (2022) |
RegioStaR7 | Regional | 2022 | Bundesministerium für Digitales und Verkehr (2021) |
Processing and analysis are undertaken using the following software: ArcGIS Pro 3.1 for the dasymetric mapping, building feature calculation and resampling of grids; QGIS 3.22, including ORS plugin for the catchment zone/isochrone calculation for physician locations; Python 3.9, including the packages numpy, xgboost, sklearn, pandas, geopandas and pyogrio for the AI-based population estimation, E2SFCA analysis and difference + grid calculation; RStudio (version 2023.09.0+463) for distribution analysis by regional type.
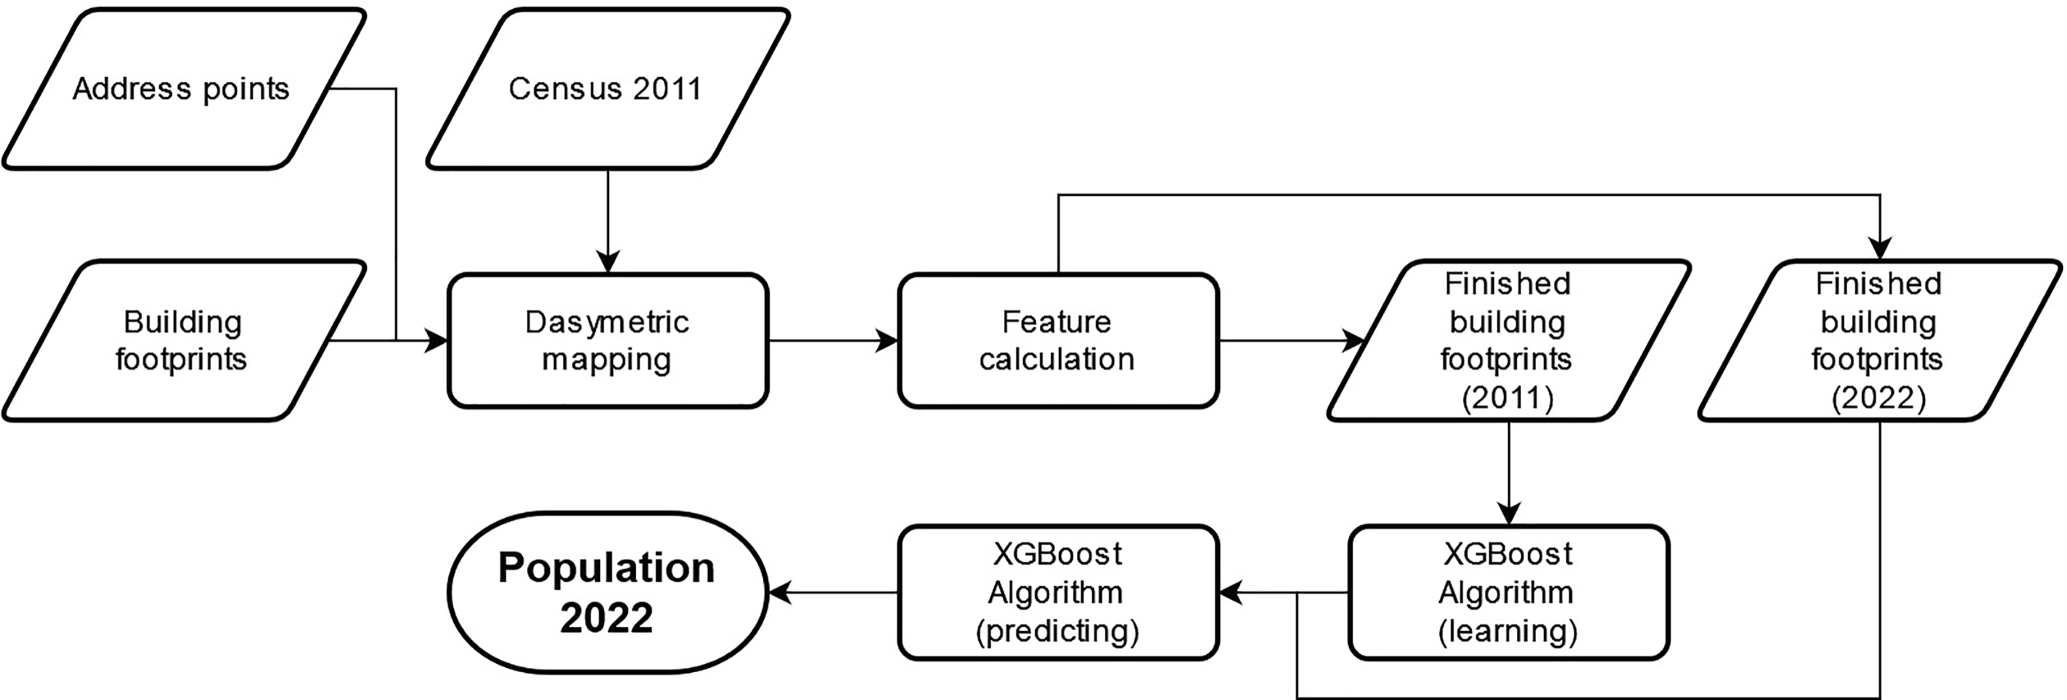
2.2.1 Data preparation and dasymetric mapping
For 2011, the 100-m-gridded census population is remapped to individual building footprints using a dasymetric approach. For this purpose, the 3D building volume is used as a mapping factor, whereas the spatial assignment of buildings to cells is undertaken with address point data (Reiter/Jehling/Hecht 2023). From the resulting basic dataset, all inhabited buildings in Germany are selected and additionally enriched with multiple building-related features. These features consist mainly of building-form-related values: building area, building volume (from the LoD2 model), ratio of minimum bounding rectangle to area, length and width of the minimum bounding rectangle, distance to next building, shape index, orientation, number of nodes (of the footprint) and the building usage (from the LoD2 model). These parameters are chosen based on Hartmann/Behnisch/Hecht et al. (2024: 221) and because they are more or less directly available from the input footprints/LoD2 model. They offer a good solution for representing a building as a table of values that describe its basic form. In the next step, a machine learning algorithm is used to learn the relations between these building features and the mapped number of inhabitants.
2.2.2 Machine learning model for population estimation
For the task of population estimation based on relations between building features and the number of inhabitants, we identified eXtreme Gradient Boosting (XGBoost) (Chen/Guestrin 2016) as an appropriate framework. XGBoost is a tree-based machine learning algorithm that builds a series of small decision trees sequentially, each one improving on the errors of the previous ones. This algorithm is one of the best suited to tabular data of the sort that we use here (Grinsztajn/Oyallon/Varoquaux 2022: 1).
Model parameter | Description | Final value |
|---|---|---|
max_depth | Maximum depth of a tree | 6 |
min_child_weight | Minimum sum of instance weight (hessian) needed in a child | 1,000 |
subsample | Subsample ratio of the training instances | 1 |
colsample_bytree | Subsample ratio of columns when constructing each tree | 1 |
learning_rate | Step size shrinkage used in update to prevent overfitting | 0.1 |
gamma | Minimum loss reduction required to make a further partition on a leaf node of the tree | 0 |
alpha | L1 regularization term on weights | 0.1 |
lambda | L2 regularization term on weights | 100 |
After deploying the population estimation model, a correction factor is applied to the estimated values. We summarize the estimated population for each municipality and compare it with the newest official population figures from the Federal Statistical Office. We then divide the difference between those figures by the number of inhabited buildings and add/subtract the resulting constant to each estimated value in that municipality. Thus, the population estimates always correspond exactly to the official statistical figures on the municipal level. In this case, the most recent available official population data is dated to 31.12.2021 (Statistische Ämter des Bundes und der Länder 2021).
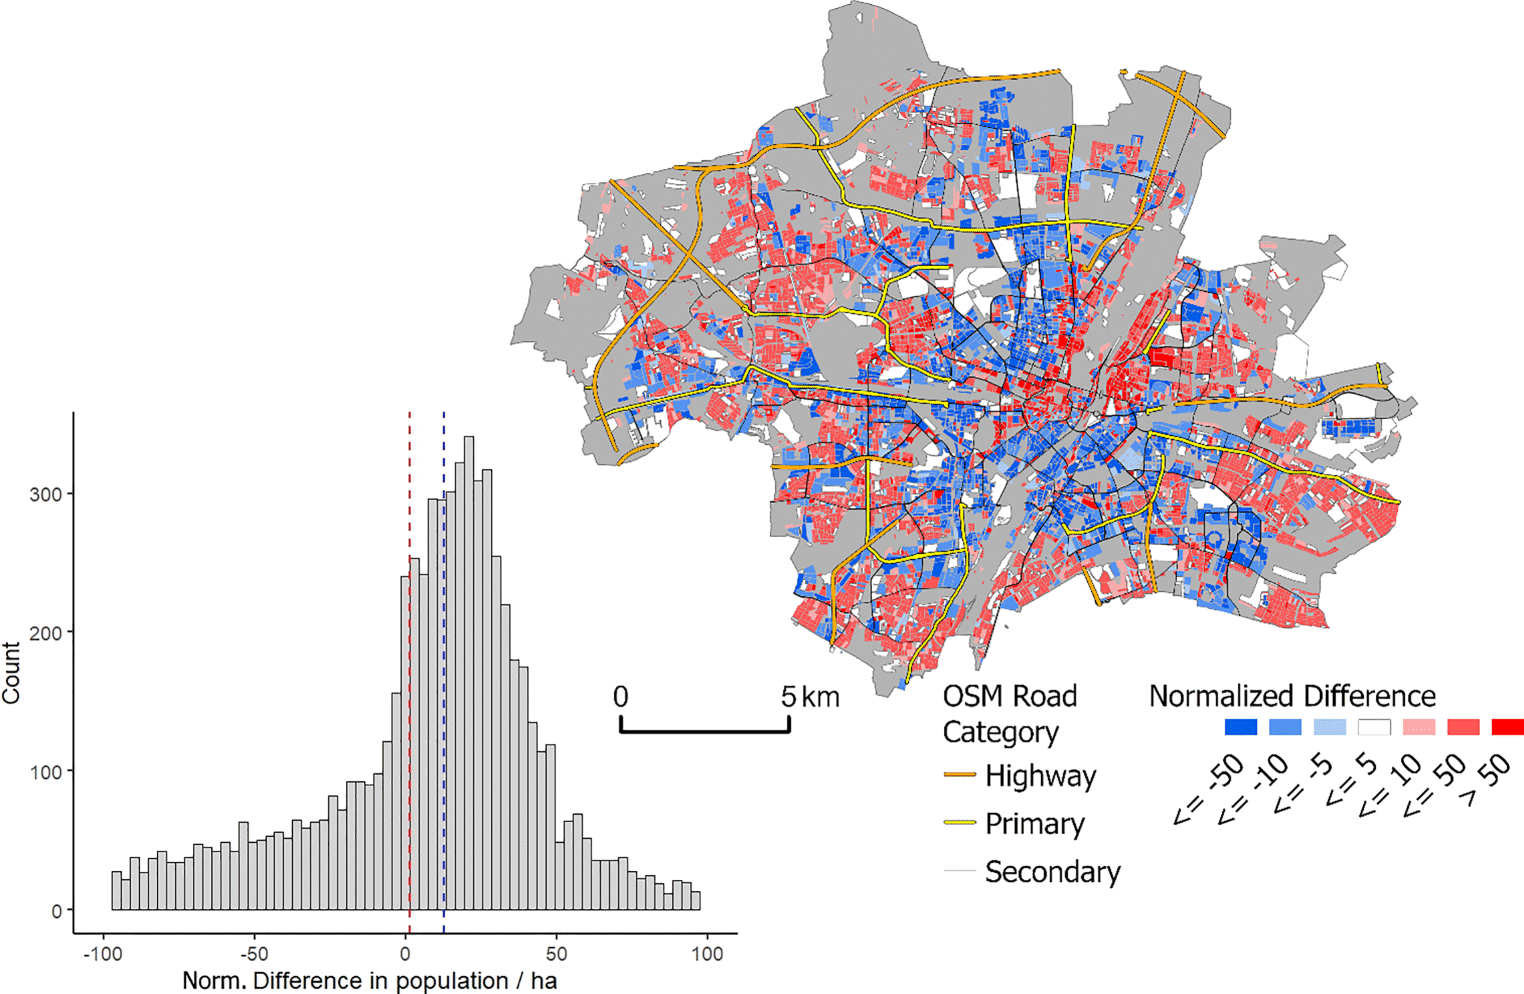
The total number of estimated inhabitants differs by 3.3 % (1.53 million according to official statistics from 2023 vs. 1.48 million estimated for 2022). 45 % of all city blocks are within +‑ 25 % range of the values from the official statistics, 75 % are within +‑ 50 %. Possibly, if we could compare our estimations with reference data from a closer point in time, we suppose that the results would be slightly better: the difference between the statistical year we capped our model estimations to (2021) and the reference year (2023) is definitely an error source.
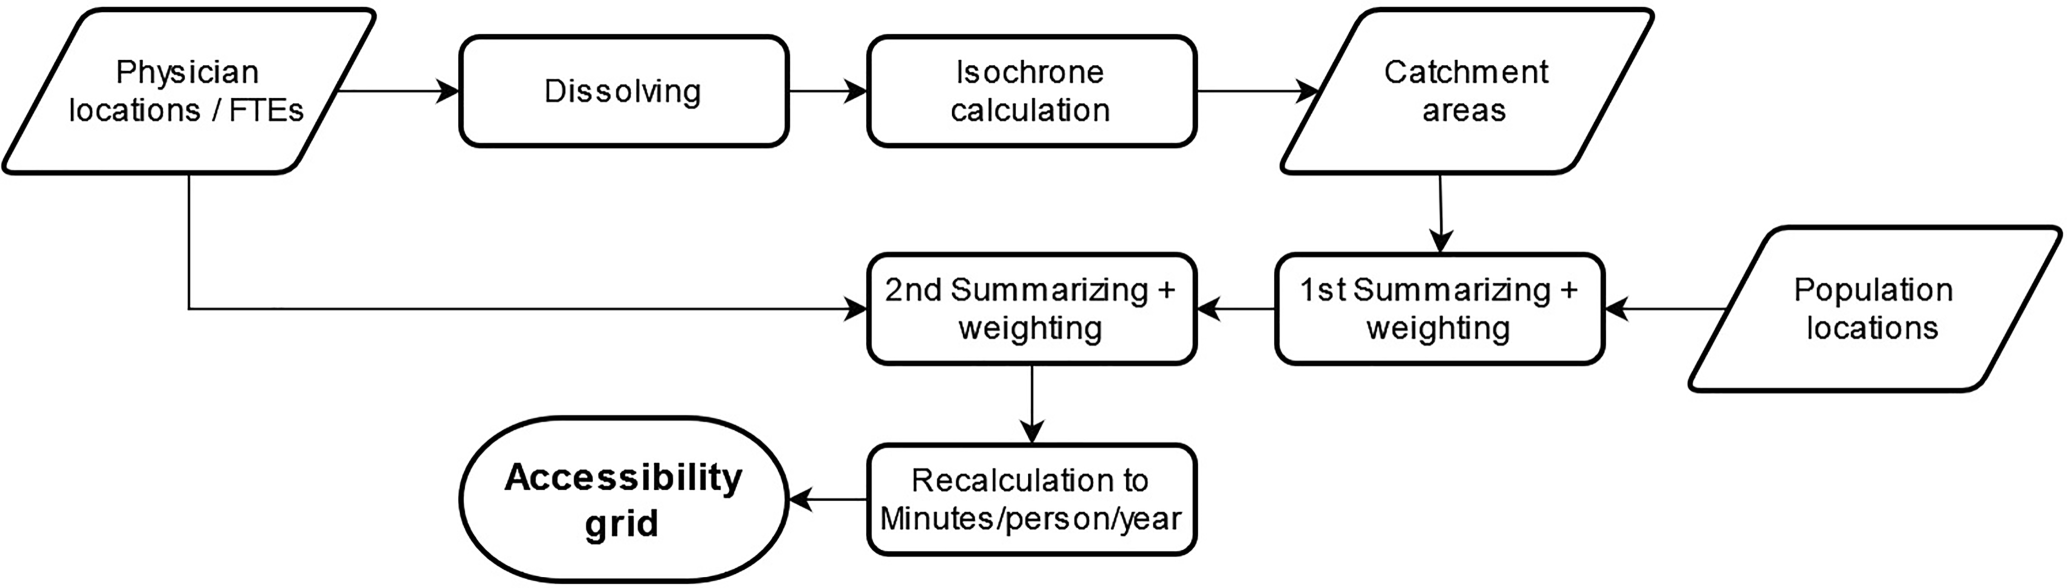
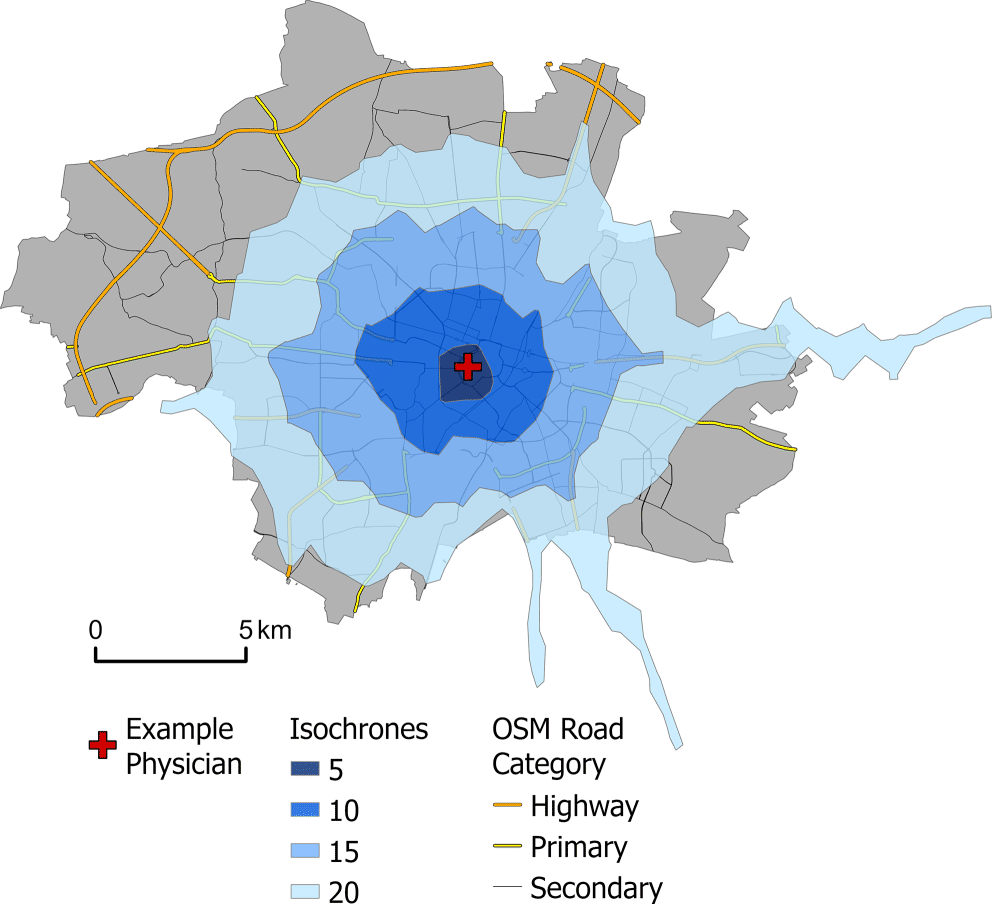
The four catchment zones are represented by isochrones generated using the OpenRouteService (ORS) (HeiGIT 2023). This service calculates network-based driving times based on the OpenStreetMap (OSM) road network (see Table 1) for different modes of transport. For our analysis, we use the “Isochrones from point”-functionality provided by the ORS-Tools plugin for QGIS. The profile for the mode of transport is set to car travel, with the range set to time dimensions of 5, 10, 15 and 20 minutes. The same network is used for calculations for 2022 and 2011, since there is no suitable network snapshot available for 2011.
Data preparation for the actual access mapping begins with summarizing the full-time equivalents of primary care physicians at any given location. Dissolving these points prevents the double processing of locations. For every obtained primary care physician location, the population within each of the four catchment zones is weighted and summarized. The weights are derived by fitting the subzones into a Gaussian distance-weighting function following Jörg/Lenz/Wetz et al. (2019: 29), resulting in 0.93 for 5 minutes, 0.57 for 10 minutes, 0.21 for 15 minutes and 0.05 for 20 minutes. By dividing the full-time equivalents at each physician location by the weighted population, the supply-demand ratio in FTE/person is calculated. Thereby, it is important to note that the calculated amount is a theoretical maximum, since competition between individual physicians is not considered.
Then, for each population location (e.g. individual buildings), the supply/demand ratios of all accessible physicians from this location are weighted depending on the catchment zone and then summarized again, using the same zones and weights as before. The result is the weighted supply/demand index (WSDI), i.e. the sum of all accessible weighted FTEs/person for each population location. The value is then converted to available working minutes per physician in one year by multiplying the WSDI by 105,600 (since 1 FTE = 40 h/week x 44 weeks x 60 min = 105,600 working minutes per year). We name this value Minutes and it should be understood as the theoretical maximum amount of time any person can spend at primary care physicians in a year (within a maximum travel distance of 20 minutes by car). The higher the value, the better the access to service provision. We apply this additional step because the Minutes value is a more understandable unit for the reader than the underlying basic WSDI, which only contains very small values.
Then, the Minutes of each individual population location (e.g. buildings) are summarized into a grid with 100 m resolution by calculating the mean for all buildings within a cell. The cell in which a building is located is determined by its address point location. This step is necessary because the buildings of 2011 do not exactly match the buildings of 2022 (due to construction or demolition of buildings). The entire process is applied identically for the years 2011 and 2022, respectively. Finally, the dynamic in service provision is derived by comparing both grids cell-by-cell. The resulting grid with the Minutes, population and FTE values is also made available for download (Reiter/Jehling/Hecht 2024).
For optimized analysis and visualization on different spatial levels and to emphasize the scalability of the approach, the data is additionally aggregated to raster levels of 1 km and 10 km resolution. The basic raster with 100 m resolution is suited for local analysis, for example on the level of an individual city, while 1 km is more appropriate for regional analysis (a federal state) and 10 km is intended for nationwide application. To this end, the values of the 100 m cells are summarized. For population, full-time equivalent and their absolute differences, the sum of all 100 m cells within a 1/10 km cell is calculated, for the respective relative values the mean is used when summarizing.
To analyse the results produced by this method, we differentiate between different regional types. For this purpose, we use the subset Combined Regional Statistical Spatial Type taken from the Regional Statistical Spatial Typology for Mobility and Transport Research (RegioStaR7; Bundesministerium für Digitales und Verkehr 2021). The key importance of this typology lies in the definition of urban (metropolis, regiopolis and large city, medium-sized city/urban area, small-town area/village area) and rural regions (central city, medium city/urban area, small-town area/village area).
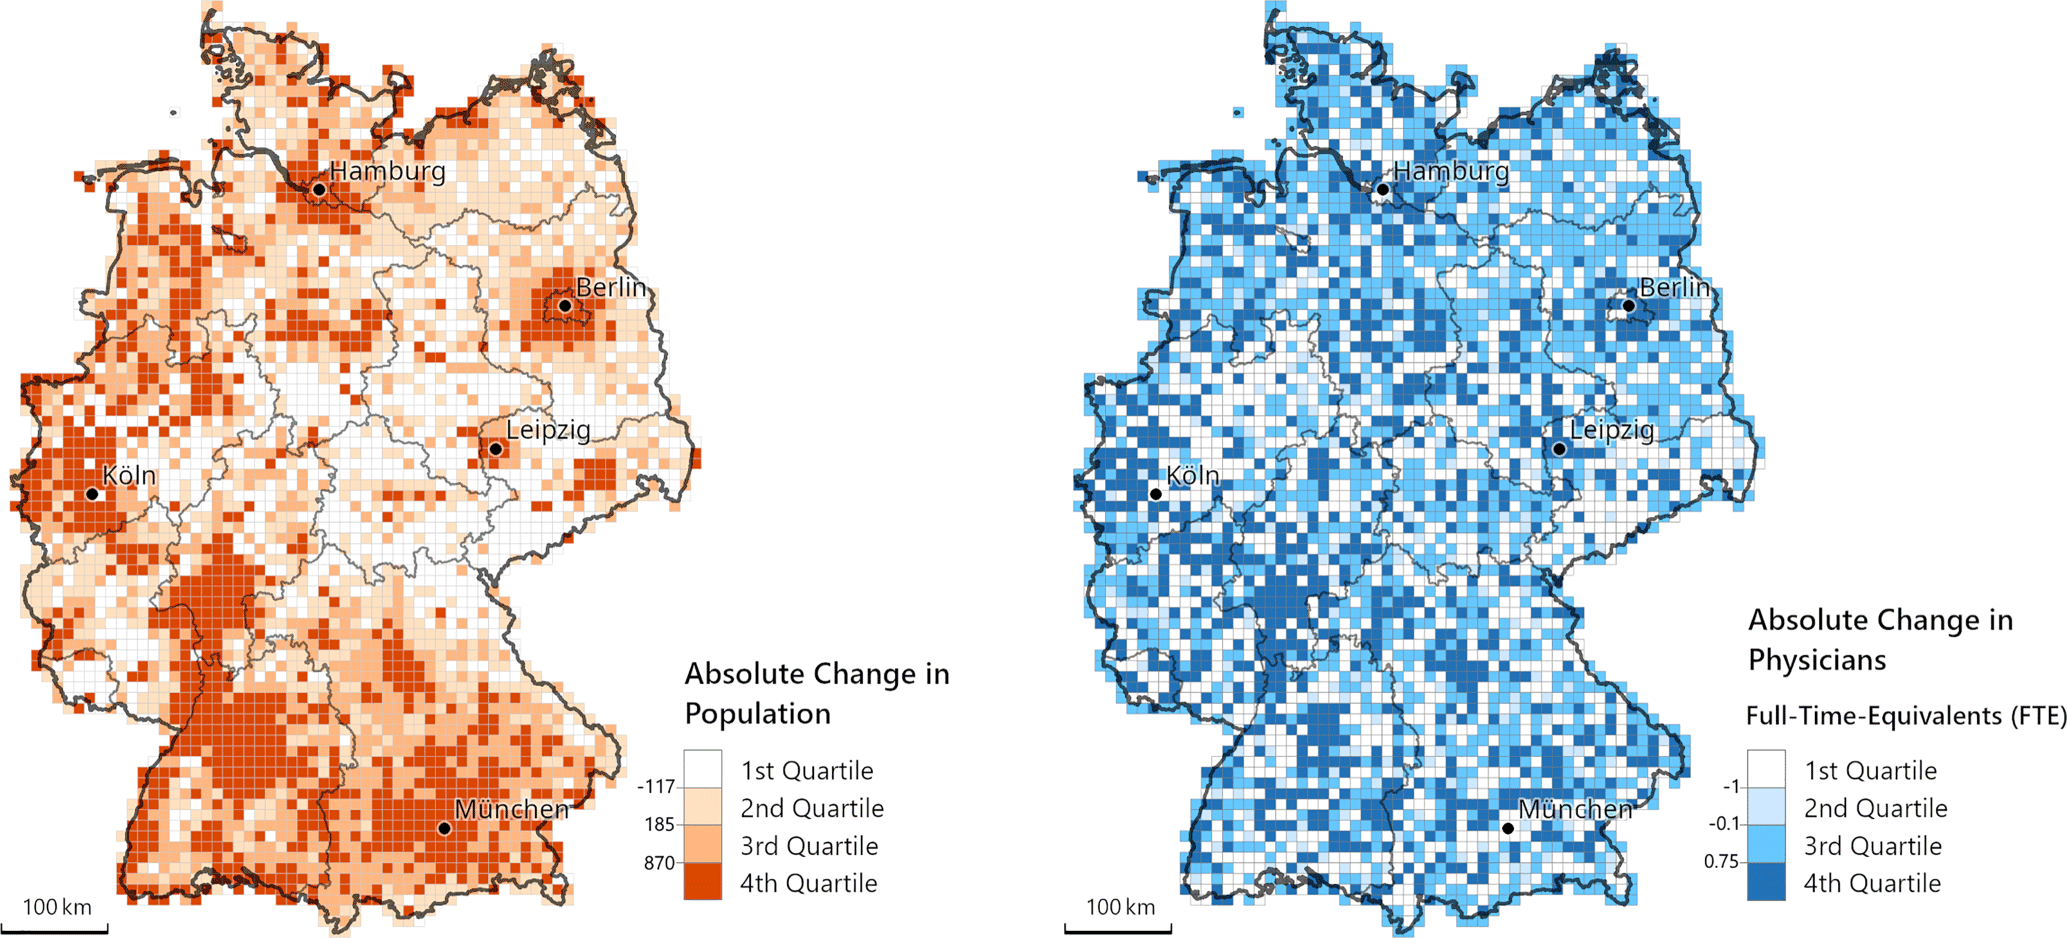
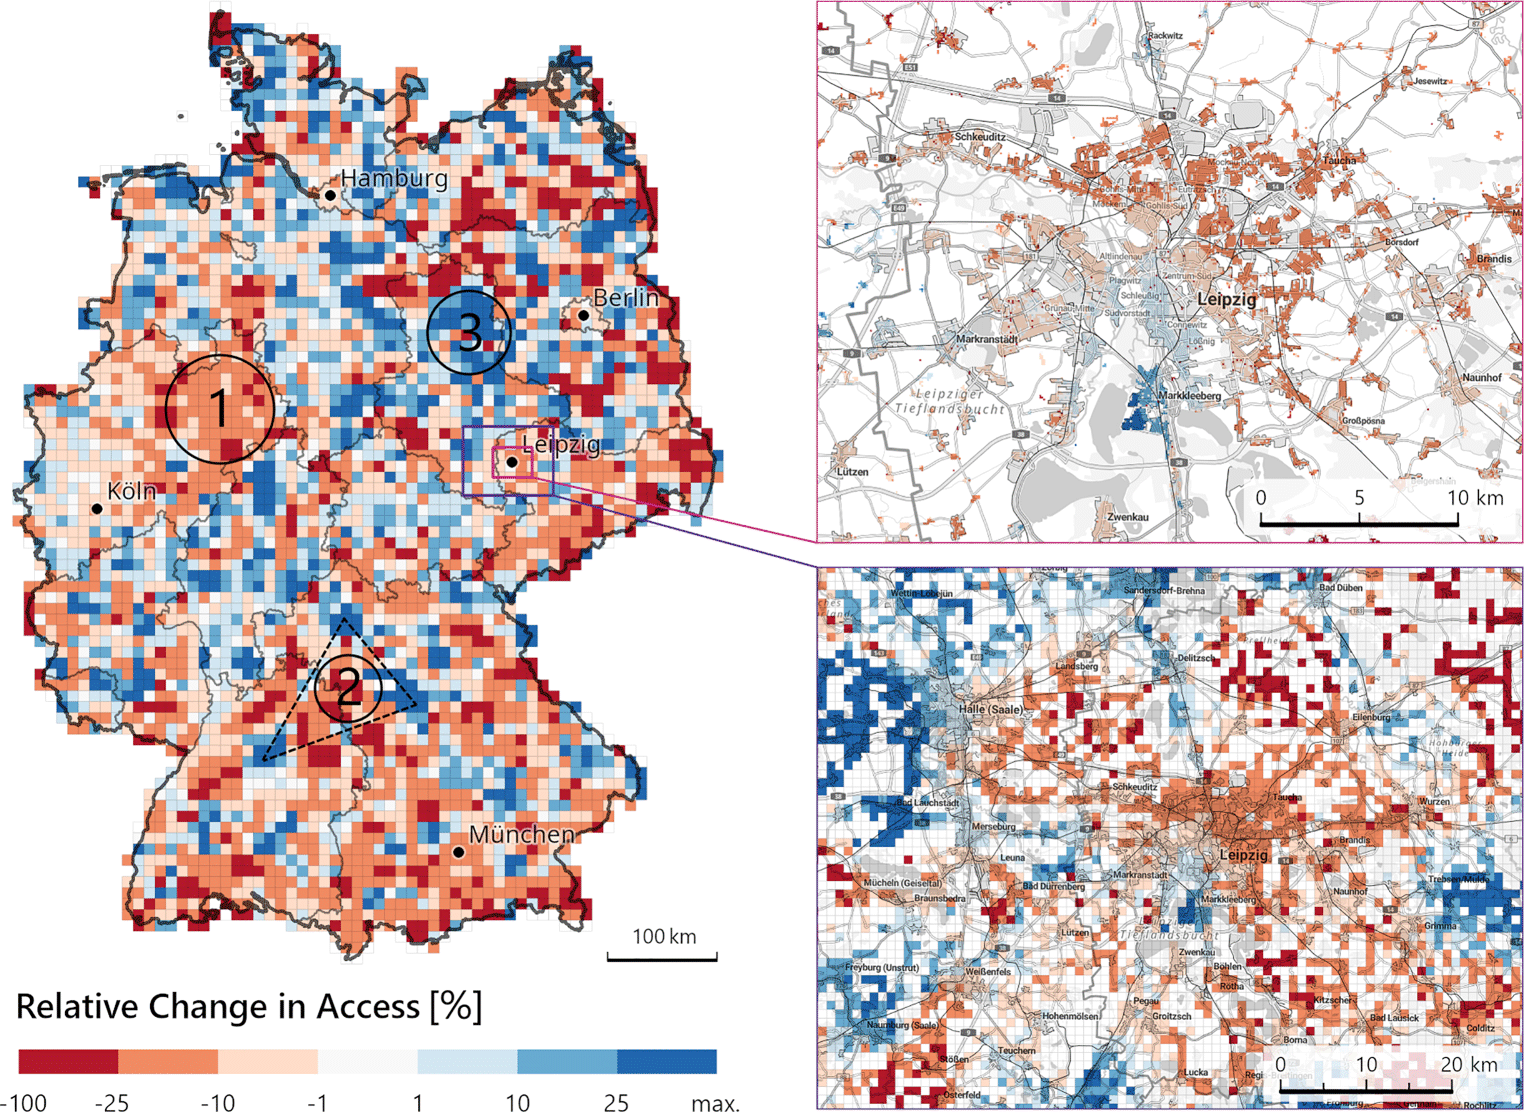
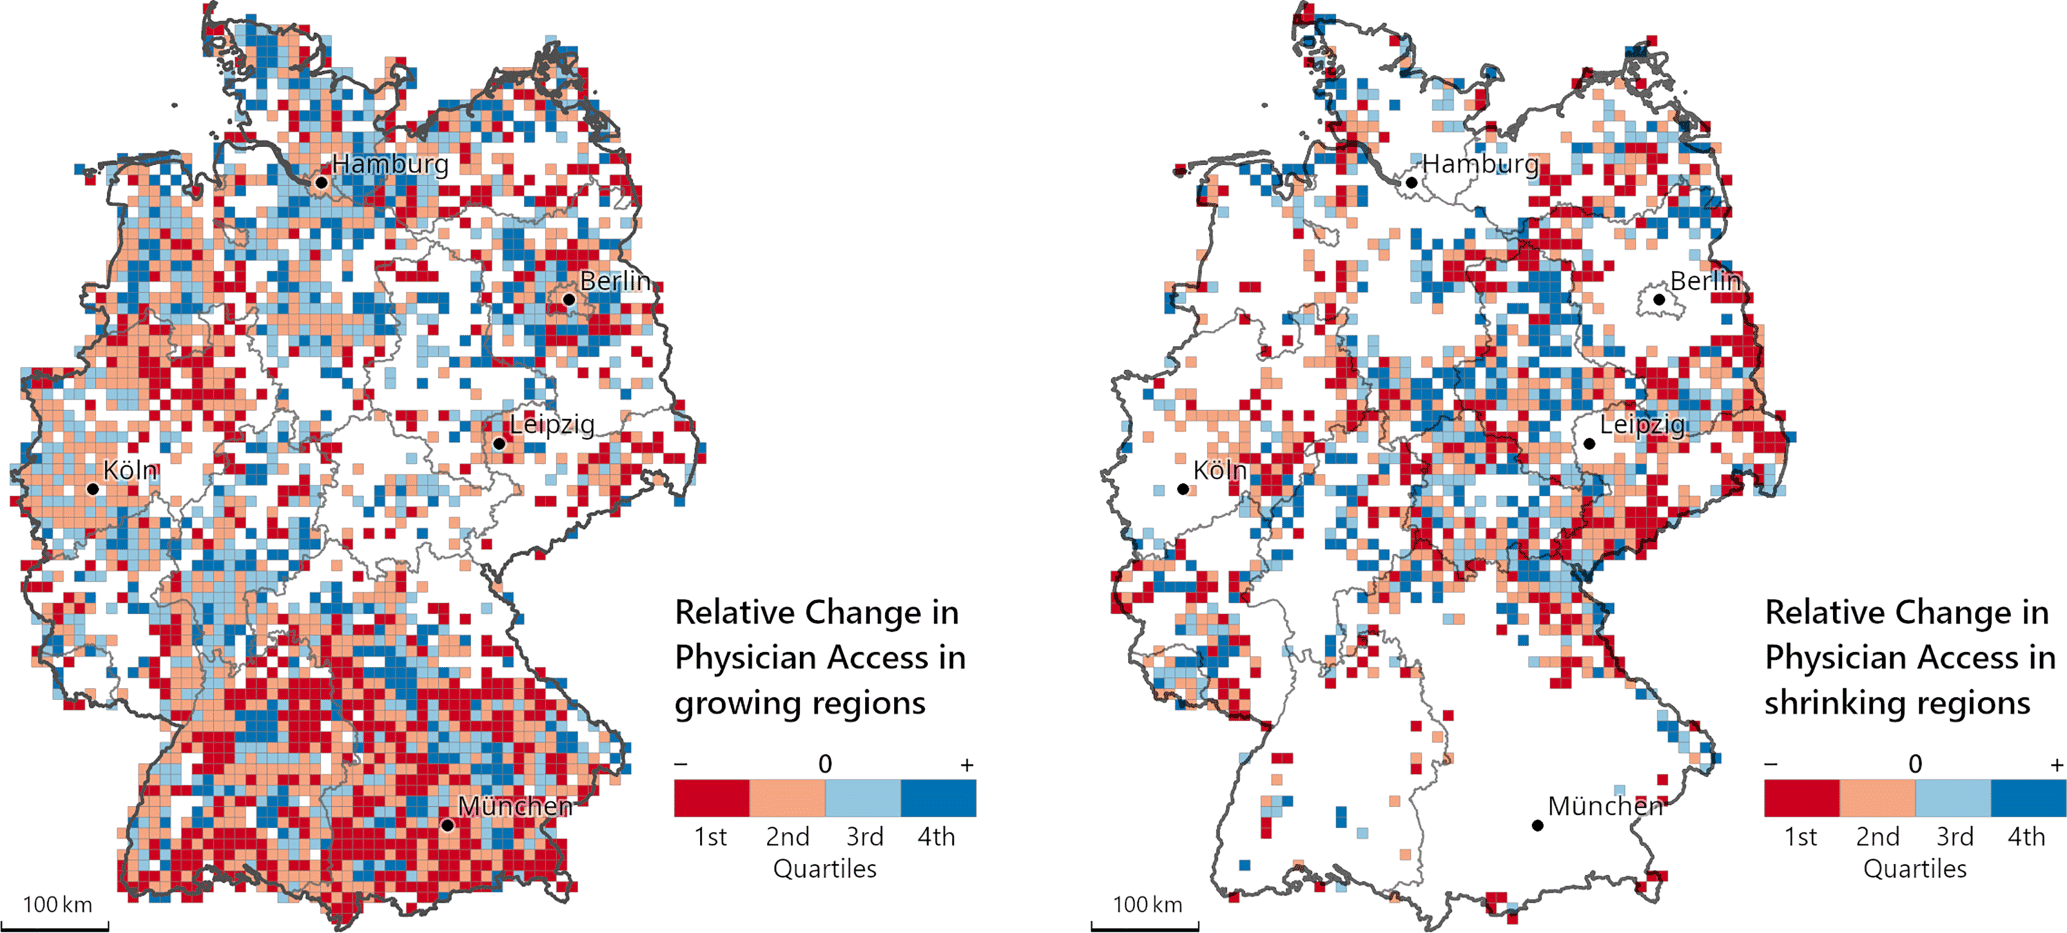
The analysis reveals Germany-wide dynamics in access to primary care physicians. Looking at the national average for non-zero cells in the 100 m grid, the measure of accessible physician time for each individual person rose from 58 Minutes in 2011 to 63 Minutes in 2022, which corresponds to an increase of 8.6 %. The median for both years is 60 Minutes. At the same time, total population only increased by 4.8 %, whilst the total number of full-time equivalents increased by 4.5 %.
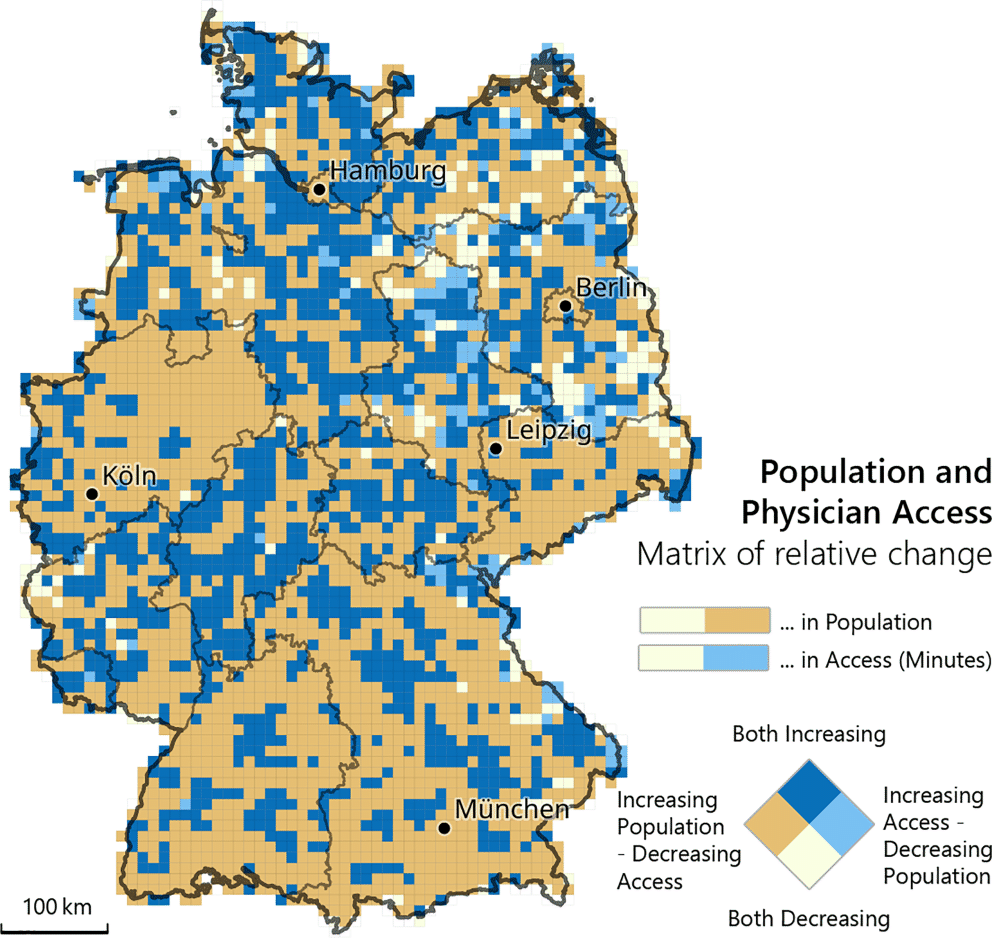
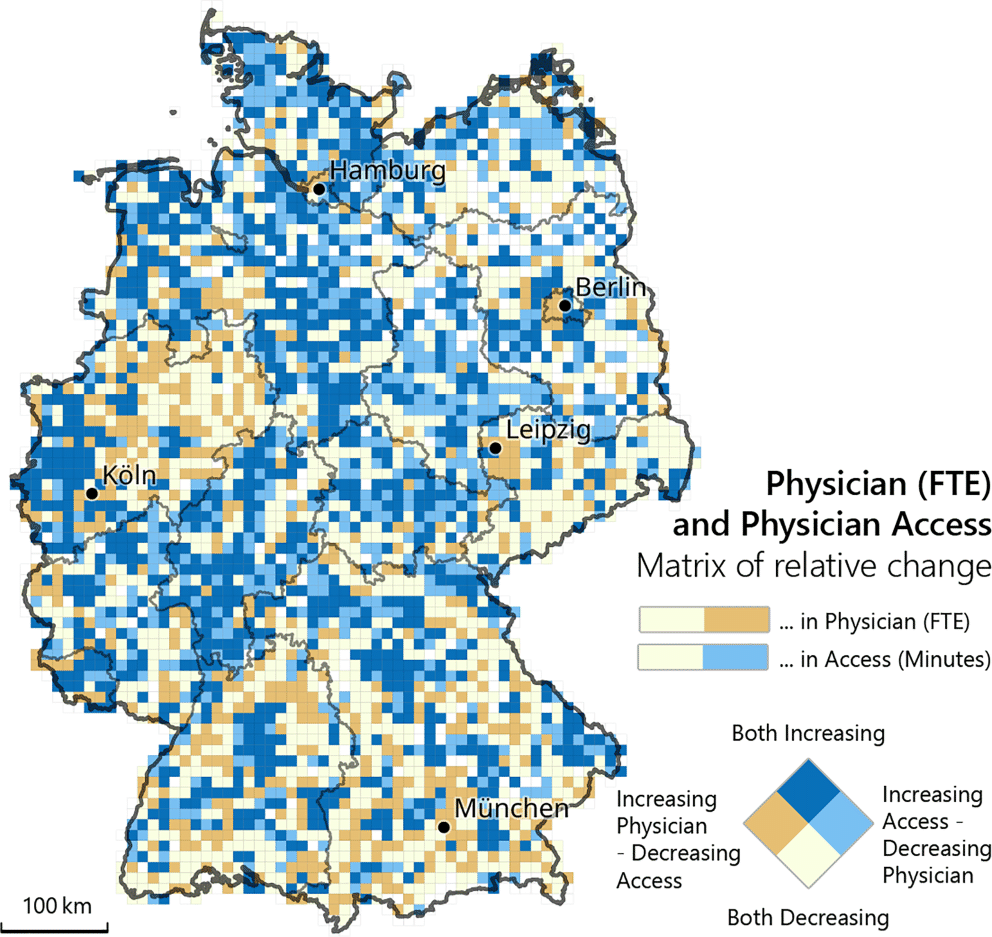
Based on these findings, we define several types of regions. The first type (“surplus in population”) includes regions with supply issues, where a loss of access results from strong population growth (Figure 8, brown colour). The second type (“surplus in access”) consists of regions with demand issues, where access is rising due to population shrinkage (Figure 8, light blue colour). The third type describes regions with a positive trend in both dimensions (Figure 8, dark blue colour), whereas the fourth type includes regions with a negative trend in both dimensions (Figure 8, light yellow colour).
In the southern states of Germany, we mainly see the first and third types, in the eastern states there is a mix of all types. Within the Münster/Paderborn region, the first type dominates strongly. The cites of Berlin, Hamburg and Munich, where there is the strongest influx of population, are of the first type.
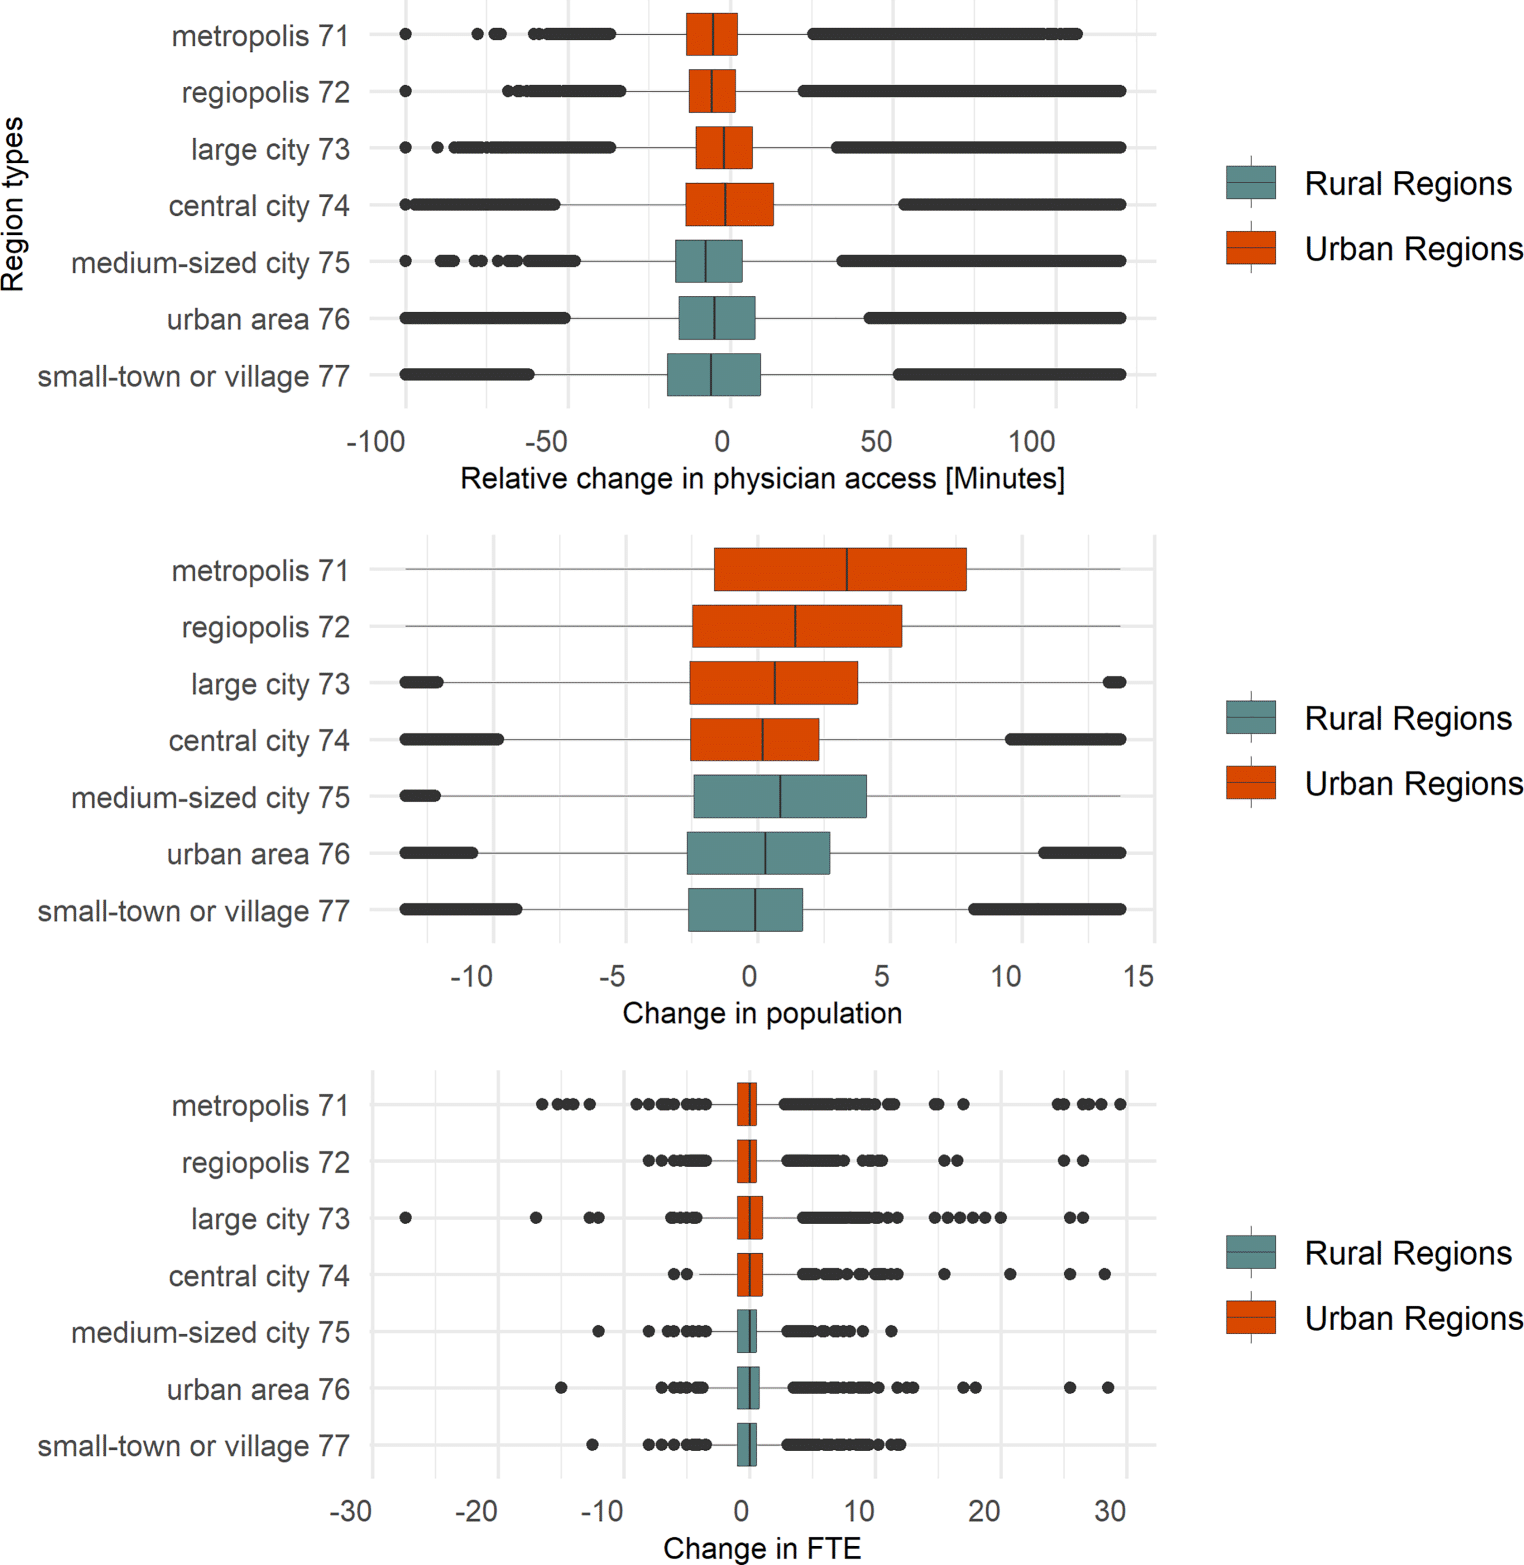
For the population, it can be said that within both the urban and rural groups, the bigger the town/city, the higher the population growth on average and the smaller the share of municipalities with shrinking populations (see Figure 10). It is interesting to note that medium-sized cities are growing more strongly than central and large cities.
There is no clear trend visible for full-time equivalents, positive and negative changes mostly even themselves out (see Figure 10).
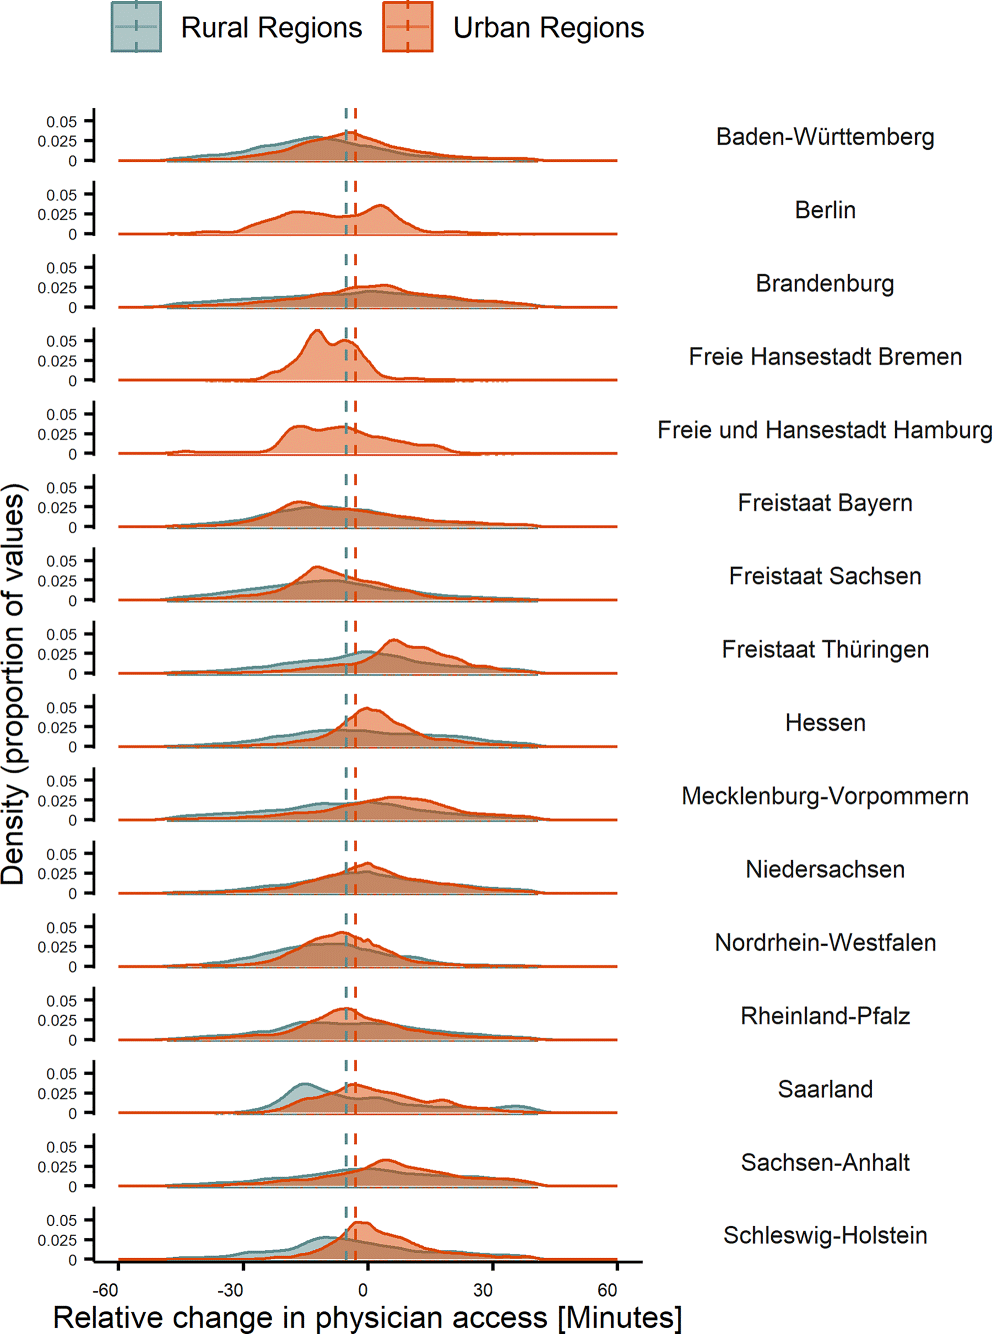
The results enable us to draw conclusions about the dynamics of access to primary care in terms of provision and demand in Germany over an eleven-year period. In more general terms, the tested approach could be valuable in creating spatial evidence for planning across multiple spatial scales with nationwide coverage. In contrast to more established spatial evaluation approaches for planning processes, which rely on predefined, administrative regions, the proposed approach allows consideration of local, regional and national relationships across the respective administrative borders.
Our analytical results show that, in general, access to primary care physicians in Germany slightly increased over the investigated period of 11 years. This increase is not evenly distributed across the spatial dimension, though. This is in line with Weingarten and Steinführer (2020: 654), who point out that in rural regions of Germany, the public discourse often revolves around the supposed “deprivation” of these regions, especially in terms of infrastructural facilities including medical services. It is therefore necessary to further analyse this problem. Our study aims to provide an understanding of the underlying dynamics, which are not entirely driven by supply issues. Küpper and Peters’ (2019: 111) analysis of other indicators also supports the thesis of rural regions not being as badly placed as often claimed in the popular media discourse.
Dynamics in supply and demand show regional differences in rural and urban settings. We identify a lot of rural regions where access to physicians is slightly rising due to the fact that the population is declining faster than the number of physicians. This does not necessarily mean that service provision in general is sufficient in these regions, but that people can potentially receive more treatment time per year in terms of absolute values. In other regions, we observe the exact opposite effect: the population is outgrowing the number of physicians and therefore access is deteriorating and treatment time per year is dropping, even though there are more physicians present. This is not limited to big cities, especially in southern Germany. Here, challenges in access arise not through the distance to facilities (accessibility) but in their capacity (availability) on a local level (Khan/Bhardwaj 1994; Guagliardo 2004: 2; Neumeier/Osigus 2024). We also observe parallel trends in larger cities, where access and population changes are both positive. These conclusions show that the analysis and interpretation of general service provision in rural and urban areas should not be dealt with by using one-dimensional approaches, e.g. change in physician numbers alone.
Generally speaking, planning for service provision is considered an important task of government and administration at multiple levels (Mause 2018; Seisenberger/Reiter 2022: 218) and is regulated in the German Spatial Planning Law (Raumordnungsgesetz).1 However, the implementation of such planning is not regulated. Medical service provision is also a special case in planning and needs to comply with additional regulations. Currently, it is defined that supply of primary care physicians is measured as a simple ratio of physicians divided by population within sharply defined planning regions (Gemeinsamer Bundesausschuss 2023). However, this falls short of real needs and possibilities in practice, as is widely confirmed by the literature (Ahlmeyer/Wittowsky 2018; Baier/Pieper/Schweikart et al. 2020; Bukow 2021).
Concerning possible solutions to these problems on the planning side, it is important to note that the planning of medical services in Germany is currently based on a demand-planning system (Bedarfsplanung) by law (§ 99 SGB V)2 using sharply defined zones (Krügel/Mäs 2023). There have been various propositions for changing this approach (Sundmacher/Schang/Schüttig et al. 2018), but no changes have so far been implemented. With our study, we show that it is possible to calculate a more sophisticated basis for future planning processes with nationwide coverage, one that considers real world travel times, actual physician capacity and population distribution on a small scale. Our findings imply that these regulatory measures should be complemented by further multi-dimensional approaches to ensure that planning and, more fundamentally, policy making can anticipate the described regional and local trends. It is also important to highlight the possibility of transferring the proposed approach to other planning tasks which require the consideration of different scales across boundaries, as shown by Seisenberger, Pajares, Hecht et al. (2023).
In our study, the E2SFCA method proved a suitable method for measuring spatial access to medical facilities. However, the approach also has limitations, as competition on the supply side is not considered (Wan/Zou/Sternberg 2012; Lingwei Chen/Chen/Lan et al. 2023). Furthermore, the calculated Minutes represent rather a theoretical maximum value of physician time to which each individual person potentially has access. However, the results of the approach are easier to understand and communicate than those of a more sophisticated, technically superior method that may be too difficult to interpret and communicate for real-life planning purposes.
Due to technical limitations, it was not possible to calculate access for the entirety of Germany in a single run, as calculating everything at once exceeded the available system memory of 256 gigabytes. Therefore, we split the data into the 16 individual federal states of Germany. To ensure continuity at the state borders, we buffered each state by 50 km for the calculations. Values directly at the outer borders of Germany suffer from a cut-off-effect though, since normally there is a co-supplying relationship between neighbouring regions (Sundmacher/Schang/Schüttig et al. 2018), but we did not have access to data outside of Germany.
The overall quality of the population data predicted for 2022 is difficult to assess as no comprehensive reference data is available on a large scale. Judging from the analysis for the city of Munich presented in Section 2.2.2, we assume that the quality is good enough to use the data in this study. It seems that our model both over- and underestimates population in Munich, which leads to a smoothing out of errors on an overall scale. In a more rural setting where housing forms are not as variable, the model seems to perform very well, which suggests the overall quality is a bit higher than results from our testing might indicate. Limited access to reference data on micro-scale population thus hinders more extensive validation. Possible improvements could tackle the issue of classification errors when separating residential and non-residential buildings, which we believe is currently the biggest source of error in the model. There is also potential for improvement with the dasymetric mapping by adding additional data sources that might improve the mapping results and ultimately the model training data.
Regarding the approach of resampling the 100 m raster to coarser resolutions, it should be noted that this induces the modifiable areal unit problem (MAUP) (Openshaw 1983), which leads to slightly differing analysis results after aggregating smaller areal units into bigger ones. This also affects rasters (Lyn 2001: 43). Between the different spatial scales presented, the values of access slightly differ when comparing overlying cells on different scales. We argue that the benefits of resampling according to the optimal spatial scale of a specific problem outweighs this effect.
The developed approach has advantages over existing transportation planning tools (for example as shown in Krügel/Mäs 2023) in that it combines a population estimation approach with the E2SCA approach for analyses that can be applied at different spatial scales. This allows a very flexible application to other topics or in other areas.
Our study demonstrates a GIS-based method for the small-scale mapping of medical service provision dynamics at the national scale, independent of pre-defined planning regions, using primary care physicians as an example. First, we quantify changes in population by using an AI-based population estimation model considering individual buildings. After that, we calculate access in (theoretically) available physician time per person for the years 2011 and 2022 and map this in raster maps. We can conclude that access to primary care physicians rose on an overall scale within the observed period, but there are significant spatial disparities noticeable.
The presented approach allows us to describe the dynamics in medical service provision for the entirety of Germany independent of regional bias across spatial scales. Our results suggest that service provision planning is not facing a one-dimensional problem. The trends we identify do not follow a common spatial typology, different regions are seen to be highly heterogeneous in their development of both supply and demand. As a result, it is likely that the traditional demand-planning system needs to be reformed to accommodate this knowledge. This could be of great importance for planning the implementation of new, digital forms of service provision or the re-structuring and concentration of facilities. Our method could provide a solid base for a better, evidence-based monitoring strategy in service provision planning, not only for medical services, but also for other types of facilities, which are key for service provision.
Research data
| Reiter, D.; Jehling, M.; Hecht, R. (2024): Changes in spatial accessibility to primary health care physicians between 2011 and 2022 in Germany (100m Raster). (Version 1.0) [Data set]. https://doi.org/10.26084/IOERFDZ-DATA-DE-2024-6 |
| References |
| Ahlmeyer, F.; Wittowsky, D. (2018): Was brauchen wir in ländlichen Räumen? Erreichbarkeitsmodellierung als strategischer Ansatz der regionalen Standort- und Verkehrsplanung. In: Raumforschung und Raumordnung | Spatial Research and Planning 76, 6, 531–550. https://doi.org/10.1007/s13147-018-0558-8 |
| Baier, N.; Pieper, J.; Schweikart, J.; Busse, R.; Vogt, V. (2020): Capturing modelled and perceived spatial access to ambulatory health care services in rural and urban areas in Germany. In: Social Science and Medicine 265, 113328. https://doi.org/10.1016/j.socscimed.2020.113328 |
| Bauer, J.; Maier, W.; Müller, R.; Groneberg, D.A. (2018): Hausärztliche Versorgung in Deutschland – Gleicher Zugang für alle? In: Deutsche Medizinische Wochenschrift 143, 2, e9–e17. https://doi.org/10.1055/s-0043-110846 |
| Bayerische Staatsregierung (2023): Landesentwicklungsprogramm Bayern (LEP) 2023. München. |
| BBSR – Bundesinstitut für Bau‑, Stadt- und Raumforschung (2023): Gute Praxis Erreichbarkeitsanalysen im Gesundheitswesen (GPEG). Bonn. = BBSR-Online-Publikation 26/2023. https://www.bbsr.bund.de/BBSR/DE/veroeffentlichungen/bbsr-online/2023/bbsr-online-26-2023.html (14.06.2024) |
| Bukow, G. (2021): Von der Geoinformation zur politischen Entscheidung. In: Bill, R.; Zehner, M.L. (eds.): GeoForum MV 2021 – Geoinformation in der öffentlichen Daseinsvorsorge: Hamburg, 7–13. |
| Bundesamt für Kartographie und Geodäsie (2012a): Amtliche Hauskoordinaten Deutschland (HK-DE). https://gdz.bkg.bund.de/index.php/default/amtliche-hauskoordinaten-deutschland-hk-de.html (14.06.2024). |
| Bundesamt für Kartographie und Geodäsie (2012b): Amtliche Hausumringe Deutschland (HU-DE). https://gdz.bkg.bund.de/index.php/default/amtliche-hausumringe-deutschland-hu-de.html (14.06.2023). |
| Bundesamt für Kartographie und Geodäsie (2021): 3D-Gebäudemodelle LoD2 Deutschland (LoD2-DE). https://gdz.bkg.bund.de/index.php/default/3d-gebaudemodelle-lod2-deutschland-lod2-de.html (14.06.2024). |
| Bundesministerium für Digitales und Verkehr (2021): Regionalstatistische Raumtypologie (RegioStaR). https://bmdv.bund.de/SharedDocs/DE/Artikel/G/regionalstatistische-raumtypologie.html (14.06.2024). |
| Chen, L.; Chen, T.; Lan, T.; Chen, C.; Pan, J. (2023): The Contributions of Population Distribution, Healthcare Resourcing, and Transportation Infrastructure to Spatial Accessibility of Health Care. In: INQUIRY: The Journal of Health Care Organization, Provision, and Financing 60, 004695802211460. https://doi.org/10.1177/00469580221146041 |
| Chen, T.; Guestrin, C. (2016): XGBoost: A Scalable Tree Boosting System. In: Association for Computing Machinery (ed.): Proceedings of the 22nd ACM SIGKDD International Conference on Knowledge Discovery and Data Mining. San Francisco, 785–794. https://doi.org/10.1145/2939672.2939785 |
| Einig, K. (2008): Regulierung der Daseinsvorsorge als Aufgabe der Raumordnung im Gewährleistungsstaat. In: Informationen zur Raumentwicklung 1/2, 17–40. |
| Gemeinsamer Bundesausschuss (2023): Richtlinie des Gemeinsamen Bundesausschusses über die Bedarfsplanung sowie die Maßstäbe zur Feststellung von Überversorgung und Unterversorgung in der vertragsärztlichen Versorgung (Bedarfsplanungs-Richtlinie). https://www.g-ba.de/downloads/62-492-3160/BPL-RL_2023-03-16_iK-2023-06-03.pdf (12.06.2024). |
| Grinsztajn, L.; Oyallon, E.; Varoquaux, G. (2022): Why do tree-based models still outperform deep learning on tabular data? http://arxiv.org/abs/2207.08815 |
| Guagliardo, M.F. (2004): Spatial accessibility of primary care: concepts, methods and challenges. In: International Journal of Health Geographics 3, 1, 3. https://doi.org/10.1186/1476-072X-3-3 |
| Hartmann, A.; Behnisch, M.; Hecht, R.; Meinel, G. (2024): Prediction of residential and non-residential building usage in Germany based on a novel nationwide reference data set. In: Environment and Planning B: Urban Analytics and City Science 51, 1, 216–233. https://doi.org/10.1177/23998083231175680 |
| Hecht, R.; Herold, H.; Behnisch, M.; Jehling, M. (2019): Mapping long-term dynamics of population and dwellings based on a multi-temporal analysis of urban morphologies. In: International Journal of Geo-Information 8, 1, 2. https://doi.org/https://doi.org/10.3390/ijgi8010002 |
| HeiGIT (2023): Open Route Service. https://openrouteservice.org/ (18.10.2023). |
| Jörg, R.; Lenz, N.; Wetz, S.; Widmer, M. (2019): Ein Modell zur Analyse der Versorgungsdichte: Herleitung eines Index zur räumlichen Zugänglichkeit mithilfe von GIS und Fallstudie zur ambulanten Grundversorgung in der Schweiz. Neuchâtel. = Obsan-Bericht 01/2019. |
| Kassenärztliche Bundesvereinigung (2023): Geokoordinaten aller deutschlandweit an der vertragsärztlichen Versorgung teilnehmenden Arzt- und Psychotherapeutenpraxen aller Fachrichtungen zu den Stichtagen 31.12.2011 und 2022 aus dem Bundesarztregister. Berlin. |
| Khan, A.A.; Bhardwaj, S.M. (1994): Access to Health Care: A Conceptual Framework and its Relevance to Health Care Planning. In: Evaluation and the Health Professions 17, 1, 60–76. https://doi.org/10.1177/016327879401700104 |
| Krings, S. (2020): Doppelt relevant: Kritische Infrastrukturen der Daseinsvorsorge. In: Raumforschung und Raumordnung | Spatial Research and Planning 78, 6, 575–593. https://doi.org/10.2478/rara-2020-0034 |
| Krügel, F.; Mäs, S. (2023): A Web-Application for Measuring Spatial Accessibility in Health Planning. In: AGILE: GIScience Series 4, 6, 1–11. https://doi.org/10.5194/agile-giss-4-6-2023 |
| Küpper, P.; Peters, J.C. (2019): Entwicklung regionaler Disparitäten hinsichtlich Wirtschaftskraft, sozialer Lage sowie Daseinsvorsorge und Infrastruktur in Deutschland und seinen ländlichen Räumen. Braunschweig. = Thünen-Report 66. https://doi.org/10.3220/REP1547565802000 |
| Langford, M.; Higgs, G.; Fry, R. (2016): Multi-modal two-step floating catchment area analysis of primary health care accessibility. In: Health and Place 38, 70–81. https://doi.org/10.1016/j.healthplace.2015.11.007 |
| Luo, W.; Qi, Y. (2009): An enhanced two-step floating catchment area (E2SFCA) method for measuring spatial accessibility to primary care physicians. In: Health and Place 15, 4, 1100–1107. https://doi.org/10.1016/j.healthplace.2009.06.002 |
| Lyn, U.E. (2001): MAUP: Modifiable Areal Unit Problem in raster GIS datasets. Raster pixels as modifiable areas. In: GIM International 15, 8, 43–45. |
| Mause, K. (2018): Daseinsvorsorge. In: Voigt, R. (Hrsg.): Handbuch Staat. Wiesbaden, 415–421. https://doi.org/10.1007/978-3-658-20744-1_37 |
| McGrail, M.R.; Humphreys, J.S. (2009): Measuring spatial accessibility to primary care in rural areas: Improving the effectiveness of the two-step floating catchment area method. In: Applied Geography 29, 4, 533–541. https://doi.org/10.1016/j.apgeog.2008.12.003 |
| Neumeier, S. (2016): Regional Distribution of Ambulant Nursing Services in Germany. A GIS Accessibility Analysis. In: Raumforschung und Raumordnung | Spatial Research and Planning 74, 4, 339–359. https://doi.org/10.1007/s13147-016-0409-4 |
| Neumeier, S.; Osigus, T. (2024): Germany’s public EV charging points: Analysing the 2023 state of expansion. In: The Geographical Journal. https://doi.org/10.1111/geoj.12570 |
| Nützel, N. (2023): Verband: Warum die Kassenärzte vor dem Kollaps stehen. https://www.br.de/nachrichten/wirtschaft/verband-warum-die-kassenaerzte-vor-dem-kollaps-stehen,TnCPh1z (13.06.2024). |
| Olivares, D.; Kohler, C. (2023): Hausärzte in Bayern: Gibt es genug oder zu wenige? https://www.br.de/nachrichten/bayern/hausaerzte-in-bayern-gibt-es-genug-oder-zu-wenig,TpXLrQ1 (13.06.2024). |
| Openshaw, S. (1983): The Modifiable Areal Unit Problem. Norwich. = Concepts and Techniques in Modern Geography 38. |
| OpenStreetMap Contributors (2022): Data snapshop retrieved on 17.11.2022 from https://download.geofabrik.de/. |
| Pajares, E.; Büttner, B.; Jehle, U.; Nichols, A.; Wulfhorst, G. (2021): Accessibility by proximity: Addressing the lack of interactive accessibility instruments for active mobility. In: Journal of Transport Geography 93, 103080. https://doi.org/10.1016/j.jtrangeo.2021.103080 |
| Penchansky, R.; Thomas, J.W. (1981): The Concept of Access: Definition and Relationship to Consumer Satisfaction. In: Medical Care 19, 2, 127–140. https://doi.org/10.1097/00005650-198102000-00001 |
| Reiter, D.; Jehling, M.; Hecht, R. (2023): Benefits of using address-based dasymetric mapping in micro-level census disaggregation. In: AGILE: GIScience Series 4, 38, 1–7. https://doi.org/10.5194/agile-giss-4-38-2023 |
| Reiter, D.; Jehling, M.; Hecht, R. (2024): Changes in spatial accessibility to primary health care physicians between 2011 and 2022 in Germany (100m Raster). (Version 1.0) [Data set]. https://doi.org/10.26084/IOERFDZ-DATA-DE-2024-6 |
| Schug, F.; Frantz, D.; van der Linden, S.; Hostert, P. (2021): Gridded population mapping for Germany based on building density, height and type from Earth Observation data using census disaggregation and bottom-up estimates. In: PLOS ONE 16, 3, e0249044. https://doi.org/10.1371/journal.pone.0249044 |
| Seisenberger, S.; Pajares, E.; Hecht, R.; Rieche, T.; Reiter, D.; Jehling, M. (2023): Entscheidungsunterstützung für die Daseinsvorsorge: Indikatoren für fachübergreifende GIS-Analysen. In: gis.Science 36, 4, 127–138. |
| Seisenberger, S.; Reiter, D. (2022): Indikatoren für die Daseinsvorsorgeplanung: Wo stehen wir heute? In: Meinel, G.; Krüger, T.; Behnisch, M.; Ehrhardt, D. (Hrsg.): Flächennutzungsmonitoring XIV. Beiträge zu Flächenmanagement, Daten, Methoden und Analysen. Berlin, 217–226. = IÖR-Schriften 80. https://doi.org/10.26084/14dfns-p022 |
| Stacherl, B.; Sauzet, O. (2023): Gravity models for potential spatial healthcare access measurement: a systematic methodological review. In: International Journal of Health Geographics 22, 1, 34. https://doi.org/10.1186/s12942-023-00358-z |
| Statistische Ämter des Bundes und der Länder (2018): Bevölkerung im 100 Meter-Gitter. https://www.zensus2011.de/DE/Home/Aktuelles/DemografischeGrunddaten.html?nn=559100#Gitter (14.06.2024). |
| Statistische Ämter des Bundes und der Länder (2021): Bevölkerung nach Geschlecht und Altersgruppen (17) – Stichtag 31.12. – regionale Tiefe: Gemeinden. https://www.regionalstatistik.de/genesis//online?operation=table&code=12411-02-03-5&bypass=true&levelindex=1&levelid=1698932901847#abreadcrumb (14.06.2024). |
| Steinführer, A. (2015): Bürger in der Verantwortung. Veränderte Akteursrollen in der Bereitstellung ländlicher Daseinsvorsorge. In: Raumforschung und Raumordnung | Spatial Research and Planning 73, 1, 5–16. https://doi.org/10.1007/s13147-014-0318-3 |
| Stentzel, U.; Piegsa, J.; Fredrich, D.; Hoffmann, W.; van den Berg, N. (2016): Accessibility of general practitioners and selected specialist physicians by car and by public transport in a rural region of Germany. In: BMC Health Services Research 16, 1, 587. https://doi.org/10.1186/s12913-016-1839-y |
| Sundmacher, L.; Schang, L.; Schüttig, W.; Flemming, R.; Frank-Tewaag, J.; Geiger, I.; Franke, S.; Weinhold, I.; Wende, D.; Kistemann, T.; Höser, C.; Kemen, J.; Hoffmann, W.; van den Berg, N.; Kleinke, F.; Becker, U.; Brechtel, T. (2018): Gutachten zur Weiterentwicklung der Bedarfsplanung i.S.d. §§ 99 ff. SGB V zur Sicherung der vertragsärztlichen Versorgung. München. |
| Tali, J.A.; Nazir, M.; Ul Shafiq, M. (2022): Enhanced Two-Step Floating Catchment Area (E2SFCA) Method for Measuring Spatial Accessibility to Primary Healthcare in HD Kote, Mysore (India). In: Rani, M.; Chaudhary, B.S.; Jamal, S.; Kumar, P. (eds.): Towards Sustainable Natural Resources. Cham, 255–273. https://doi.org/10.1007/978-3-031-06443-2_14 |
| Wan, N.; Zou, B.; Sternberg, T. (2012): A three-step floating catchment area method for analyzing spatial access to health services. In: International Journal of Geographical Information Science 26, 6, 1073–1089. https://doi.org/10.1080/13658816.2011.624987 |
| Weingarten, P.; Steinführer, A. (2020): Daseinsvorsorge, gleichwertige Lebensverhältnisse und ländliche Räume im 21. Jahrhundert. In: Zeitschrift für Politikwissenschaft 30, 4, 653–665. https://doi.org/10.1007/s41358-020-00246-z |